
When economic growth is scarce, growth equities — stocks growing faster than peers and/or the market, and therefore typically command higher valuations — tend to be more attractive to investors. Yet, despite this year’s decelerating economic growth, the market trend has been quite the opposite in 2022. The Nasdaq-100®Index fell into bear market territory in late April, while small-cap growth, as measured by the Russell 2000® Growth Index, has been in a year-long drawdown. Growth stocks have suffered as inflation is near 40-year highs, causing the Federal Reserve (Fed) to embark on an aggressive path of planned interest rate increases to combat rising prices. Given this backdrop, investors may wonder what growth stocks have left to offer. There are three headwinds for growth stocks right now that we expect to either resolve or become tailwinds as the year progresses. In this market commentary, we provide our outlook for growth stocks and highlight our high-level views on asset allocation.
Tightening Financial Conditions
As the Fed seeks to rein in high inflation through policy measures such as raising rates and shrinking its balance sheet, officials are monitoring the impact policy measures are having on financial conditions. Tightening monetary policy generally leads to tightening financial conditions, helping to slow down the pace of economic growth, as evidenced by an array of data points, including decreasing equity valuations, credit spread widening and increasing strength of the U.S. dollar.
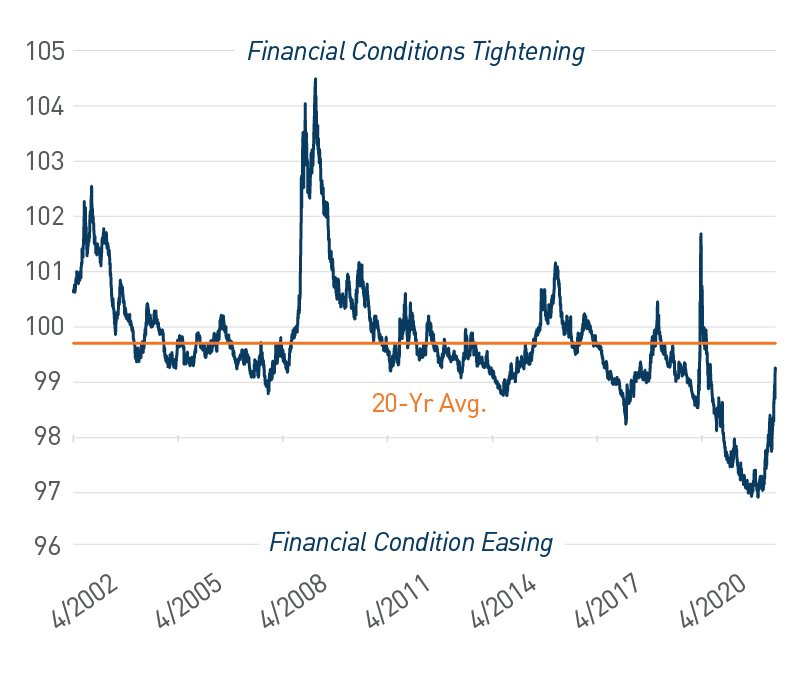
Using the Goldman Sachs Financial Conditions Index as a proxy, data shows the speed at which financial conditions have tightened in recent months. Notably, financial conditions did not tighten when the Fed began to taper its quantitative easing program in November 2021. Instead, tightening took hold in January when the Fed’s forward guidance shifted toward aggressive rate hikes, shrinking its $9 trillion balance sheet and slowing the growth of money supply due to spiking inflation. While it appears the Fed has successfully tightened financial conditions, over a 10-year time horizon, financial conditions are essentially unchanged. Compared to the last 20 years, we believe financial conditions potentially have room to tighten further.
Figure 1. Goldman Sachs Financial Conditions Index
Perspective matters on how much tightening still needs to occur
As of 5/10/2022. Source: Bloomberg, L.P.
View accessible version of this chart.
Stocks with high valuations become vulnerable in such an environment, which has been precisely the case this year. For example, the forward price-to-earnings multiple of the Nasdaq-100 has declined from 31 times (x) at the start of the year to almost 22x — a nearly 10x multiple compression. For perspective, multiples compressed the same amount during the financial crisis, while they only declined by 6x in the first-quarter 2020.
So, when does the Fed stop tightening financial conditions? The answer lies in the path forward for inflation, which is negatively impacting valuations across the multi-asset class universe.
Rising Inflation, Falling Valuations
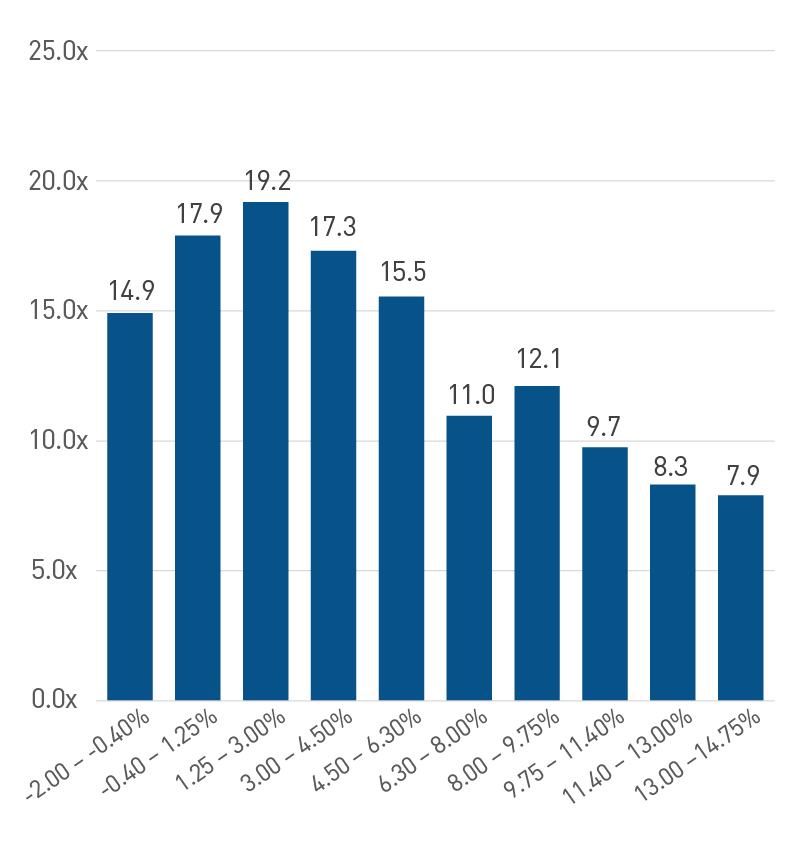
Earnings continue to be strong for equities in general, leaving elevated inflation as the primary headwind for multiple expansion, in our view. Since the inception of the S&P 500® in 1954, there has been an inverse correlation between equity valuations and inflation. As inflation moves higher, valuations typically move lower. Therefore, the opposite is also true. When inflation shifts lower, it eases the strain on valuations. As such, while the recent Consumer Price Index (CPI) report was higher than the consensus estimate, it was lower than the prior month’s reading. Other market-based indicators, such as 2- and 5-year U.S. Treasury breakeven interest rates, which indicate the market’s expectation for inflation in two and five years, respectively, both peaked in March as well.
Figure 2 . Average S&P 500 Trailing P/E by CPI Tranche 1954 – 2022
Higher levels of inflation historically pressure valuations
As of 4/30/2022. Source: Bloomberg, L.P., PNC
View accessible version of this chart.
We continue to monitor rising prices beyond just hard data like CPI to determine if inflation has indeed peaked. Several surveys, including the purchasing managers index, regional Fed and consumer sentiment, include a section on inflation, which are typically a reliable guide for forward-looking inflation expectations. According to recent survey data, inflation is expected to remain elevated for the rest of the year, but more signals are confirming it has peaked. This would surely be a welcome relief for consumers that are facing rapidly rising gasoline and food prices across the country.
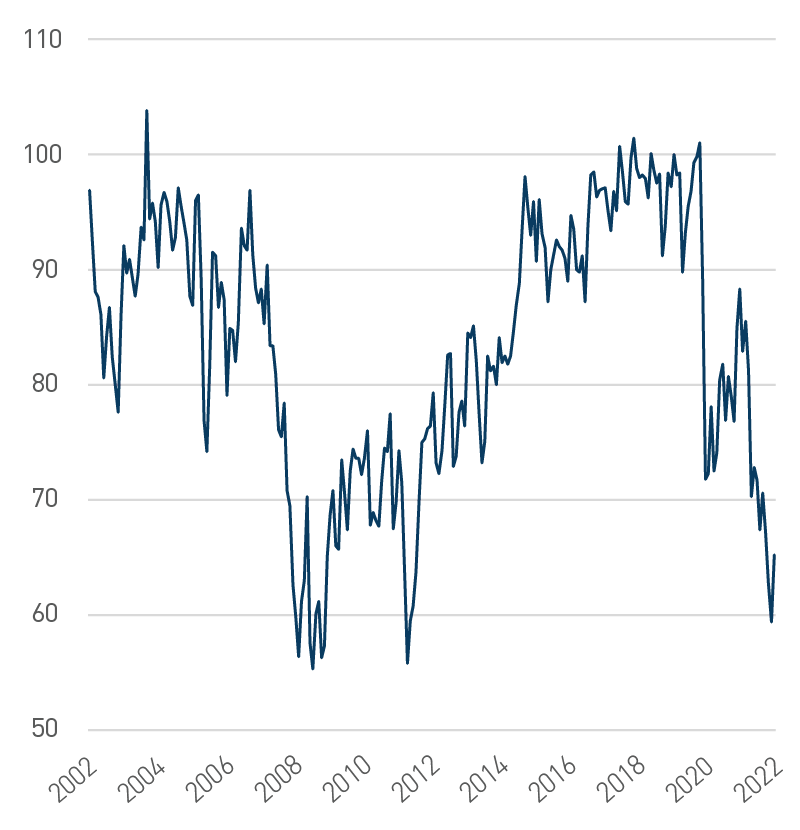
Consumer Sentiment is Deflated
Consumer sentiment at extremely negative levels
Where do we go from here?
We believe sentiment is likely to improve once concrete evidence surfaces that inflation is falling. It could take several months before it becomes clear the worst is behind us. Until then, we expect markets to remain quite volatile as policymakers seek to tighten financial conditions due to rising inflation, which is weighing on consumer sentiment.
Due to ongoing market volatility, we continue to advise against concentrated asset allocations and remain in favor of broad diversification. We are favorable toward larger market capitalization equities and encourage investors to look for tactical opportunities to rebalance style drift in portfolios as growth stocks have meaningfully lagged due to valuation adjustments. Even if inflation declines from peak levels, allocations such as real estate and small- and mid-cap value equities should provide support during periods of heightened market volatility.
Accessible Version of Charts
Figure 1: Goldman Sachs Financial Conditions Index
Perspective matters on how much tightening still needs to occur
Date |
Goldman Sachs Financial Conditions Index |
20Y Average |
5/10/2002 |
100.99 |
99.67863636 |
5/9/2003 |
100.53 |
99.67863636 |
5/10/2004 |
100.42 |
99.67863636 |
5/10/2005 |
99.73 |
99.67863636 |
5/10/2006 |
99.56 |
99.67863636 |
5/10/2007 |
99.19 |
99.67863636 |
5/11/2007 |
99.14 |
99.67863636 |
5/9/2008 |
99.33 |
99.67863636 |
5/11/2009 |
102.51 |
99.67863636 |
5/10/2010 |
100.46 |
99.67863636 |
5/10/2011 |
99.26 |
99.67863636 |
5/10/2012 |
99.74 |
99.67863636 |
5/10/2013 |
99.19 |
99.67863636 |
5/9/2014 |
99.04 |
99.67863636 |
5/8/2015 |
99.44 |
99.67863636 |
5/10/2016 |
99.99 |
99.67863636 |
5/10/2017 |
99.63 |
99.67863636 |
5/10/2018 |
99.02 |
99.67863636 |
5/10/2019 |
99.42 |
99.67863636 |
5/11/2020 |
99.8 |
99.67863636 |
5/10/2021 |
97.31 |
99.67863636 |
5/10/2022 |
99.23 |
99.67863636 |
As of 5/10/2022. Source: Bloomberg, L.P.
Figure 2: Average S&P 500 Trailing P/E by CPI Tranche 1954-2022
Higher levels of inflation historically pressure valuations
CPI Ranges |
Average S&P 500 Trailing P/E |
-2% to -0.4% |
14.9 |
-0.4% to 1.25% |
17.9 |
1.25% to 3% |
19.2 |
3% to 4.5% |
17.3 |
4.5% to 6.3% |
15.5 |
6.3% to 8% |
11.0 |
8% to 9.75% |
12.1 |
9.75% to 11.4% |
9.7 |
11.4% to 13% |
8.3 |
13% to 14.75% |
7.9 |
As of 4/30/2022. Source: Bloomberg, L.P., PNC
Consumer sentiment at extremely negative levels
Date |
University of Michigan Consumer Sentiment |
4/30/2003 |
86 |
4/30/2004 |
94.2 |
4/30/2005 |
87.7 |
4/30/2006 |
87.4 |
4/30/2007 |
87.1 |
4/30/2008 |
62.6 |
4/30/2009 |
65.1 |
4/30/2010 |
72.2 |
4/30/2011 |
69.8 |
4/30/2012 |
76.4 |
4/30/2013 |
76.4 |
4/30/2014 |
84.1 |
4/30/2015 |
95.9 |
4/30/2016 |
89 |
4/30/2017 |
97 |
4/30/2018 |
98.8 |
4/30/2019 |
97.2 |
4/30/2020 |
71.8 |
4/30/2021 |
88.3 |
4/30/2022 |
65.2 |
As of 4/30/2022. Source: Bloomberg, L.P.