
As the industry moves towards a value-driven care delivery model, health systems and physicians are integrating to deliver an improved patient experience and ultimately improve quality and value. These integration strategies come with a cost but can be managed and aligned to meet the needs of all stakeholders.
Health systems invest on average 2% to 10% of net revenue on physician integration strategies. Returns vary significantly based on the degree of alignment that results.
Physician integration strategies comprise a variety of initiatives across the enterprise including employment models, professional service agreements (PSAs) and affiliations, hospital based clinicians and Accountable Care Organizations (ACO’s).
There are a number of barriers – but also intriguing opportunities to successful physician integration.
Fragmented Goals and Decision-Making
Many physician alignment efforts are fragmented. Different stakeholders across an organization have varying degrees of physician responsibility and accountability. Currently, there are multiple methodologies deployed to administer compensation and incentives. Negotiations are focused on optimizing each individual “deal” rather than the “whole” at a service line level. However, doing nothing could be worse than doing something for health systems.
There are opportunities to align efforts across the enterprise to bring together stakeholders to ensure that vertical and horizontal initiatives are aligned with enterprise-wide guiding principles and methodologies. Existing information systems and data modeling can be designed to better align physicians and services. Designing and deploying a unified and aligned compensation and incentive model drives system goals and strategies. Successful alignment strategies address:
- Compensation and incentives
- Roles and performance standards
- Service line agreements and support
- Deployment plans
- These strategies span employed physicians, professional service agreements, clinically integrated networks and independent physicians.
Physician Investment
Health systems spend on average 2% to 10% of revenue on physicians, either in non-employed or employed physician payment models. Non-employed payments may take the form of medical directorships, coverage and call payments, locums and service contracts.
Employed payment models include practice losses, subsidies and compensation.
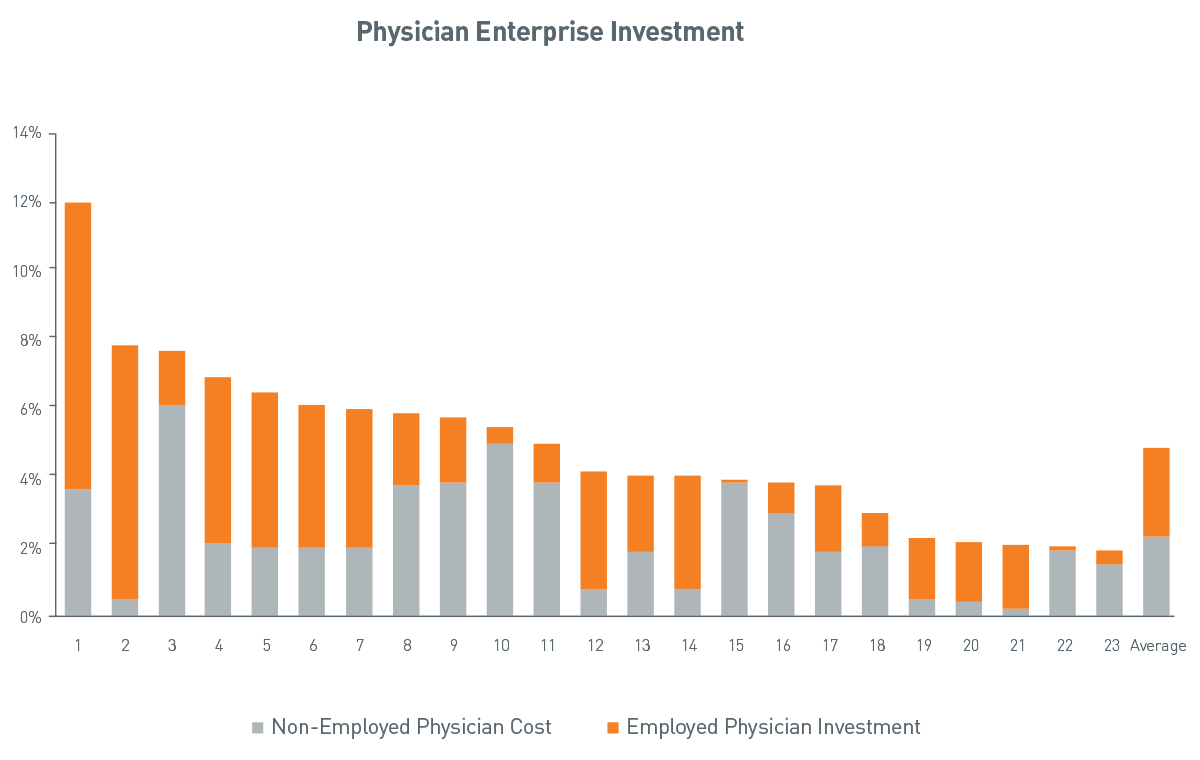
Source: PNC Healthcare Advisory Services
View accessible version of this chart.
Losses on Employed Physicians by Segment
A health system that spends $100 million on their physician enterprise strategy will typically spend the following:
38% on employment agreements
23% on specialty-specific service agreements
22% on hospitalists, anesthesia coverage, call coverage and medical directorships
19% on investments in accountable care organizations and shared savings agreements
Physician- vs. Hospital-Owned Losses
Most physician-owned practices break even. Mean net income ranges from $35,000 - $65,000. Non-surgical single specialties have the highest net income. Median subsidies for hospital-owned practices range from $175,000 to $320,000.
Losses on employed physicians are only part of the total investment. While approximately one third of the investment may be on employment agreements, the remainder of the investment is on PSA’s and affiliations, hospital-based physician contracts (hospitalist, anesthesia and coverage/medical directorships) and ACO’s.
An Example
In one example, a health system’s physician investment was 11% of hospital revenue vs. a benchmark of 5%. Investment per physician exceeded $320,000 per year compared to benchmarks of $130,000. Due to other cost and revenue pressures, this level of investment was unsustainable. Options for improvement included reducing the number of physicians by 10%, increasing productivity by 15%, improving revenue by 5% and decreasing expenses by 2%. The result would be a nearly $15 million improvement.
While this was one solution, a more sustainable solution was a service line approach to achieve the same result. Under traditional relationship models, even with the best of intentions, physician concerns make alignment with hospital concerns difficult at best. Personal income, malpractice costs, work load vs. hospital concerns such as access to capital, margin, access and care standardization are among those concerns.
Rather than making incremental adjustments to the physician enterprise, this organization aligned service lines to include inpatient, outpatient and physician revenue and expenses and made decisions collectively with clinicians by service. The economics of the service line (neuro, ophthalmology, orthopedics, etc.) was the driving force to achieve the desired contribution margin of that service. Investments in a particular service line could then be made strategically and the organization could disproportionately invest in strategic services and areas for growth.
Conclusion
Multiple avenues exist for hospitals and physicians to construct and move toward a clinically integrated relationship. Physician integration involves providers working together in an interdependent fashion so that they can:
- Pool infrastructure and resources
- Develop, implement and monitor protocols and best practices
- Furnish higher quality care in a more efficient manner than they likely could achieve working independently.
Want to know more?
For more information about PNC’s view on industry trends or how PNC can help with designing and documenting cash reconciliation processes, fill out a simple Contact Form and we’ll get in touch with you.
Accessible Version of Chart
Physician Enterprise Investment
| Average | Non-Employed Physician Cost | Employed Physician Investment |
|
| 1 | 3.7% | 8.3% | 12.0% |
| 2 | 0.5% | 7.4% | 7.9% |
| 3 | 6.1% | 1.7% | 7.8% |
| 4 | 2.1% | 4.9% | 7.0% |
| 5 | 2.0% | 4.5% | 6.5% |
| 6 | 1.9% | 4.2% | 6.1% |
| 7 | 2.1% | 4.0% | 6.0% |
| 8 | 3.8% | 2.1% | 5.9% |
| 9 | 3.9% | 1.9% | 5.8% |
| 10 | 5.0% | 0.5% | 5.5% |
| 11 | 3.9% | 1.1% | 5.0% |
| 12 | 0.8% | 3.4% | 4.2% |
| 13 | 1.8% | 2.4% | 4.2% |
| 14 | 0.8% | 3.4% | 4.1% |
| 15 | 3.9% | 0.1% | 4.0% |
| 16 | 3.0% | 0.9% | 3.9% |
| 17 | 1.9% | 1.9% | 3.8% |
| 18 | 2.0% | 1.0% | 3.0% |
| 19 | 0.5% | 1.8% | 2.3% |
| 20 | 0.4% | 1.8% | 2.2% |
| 21 | 0.2% | 1.9% | 2.1% |
| 22 | 1.9% | 0.2% | 2.1% |
| 23 | 1.5% | 0.5% | 2.0% |
| 2.3% | 2.6% | 4.9% |
Source: PNC Healthcare Advisory Services