
Over recent decades, the U.S. has accumulated a federal deficit that is now on par with levels typically seen during recessions. Likewise, federal debt levels have also increased substantially. Thus far, financial markets have largely brushed off concerns over these growing balances — aside from acute periods of consternation over debt ceiling deadlines and credit rating downgrades. However, we expect these issues to soon return to the fore, given the upcoming presidential election and expiration of the debt limit suspension, set for January 2025. In this publication, we discuss the high-level implications of current debt and deficit levels and what they mean for long-term investors.
How did we get here?
According to the Congressional Budget Office (CBO), the deficit will grow from an equivalent of 5.6% of GDP in 2024 to 6.1% in 2034 (Figure 1). Furthermore, federal debt levels are expected to climb from 99% of GDP to 116% over that same period. There are myriad causes of these sizeable balances, but the effects of government intervention during the global financial crisis and COVID-19 pandemic exacerbated their growth trajectory.
Figure 1. U.S. Federal Budget Surplus/Deficit (% of GDP)
The deficit is on par with levels typically seen during recessions
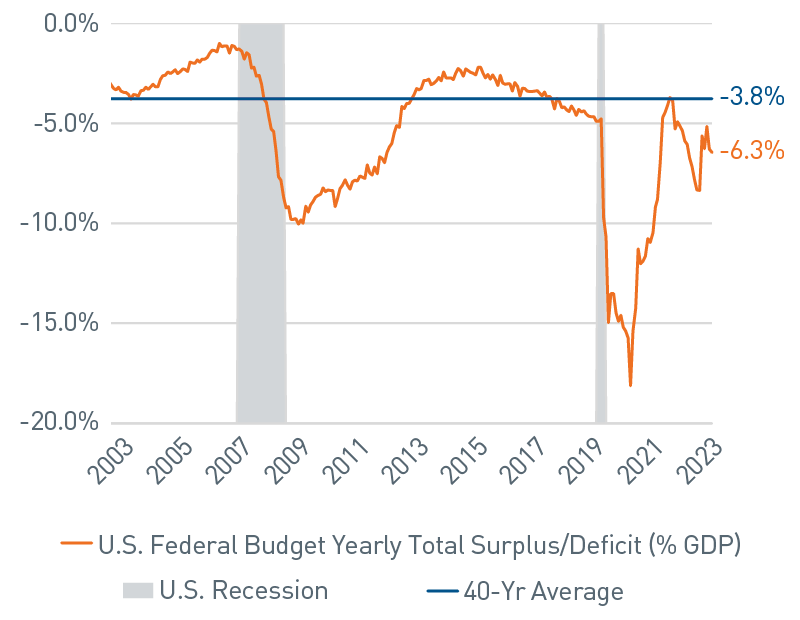
As of 1/31/2024. Source: Bloomberg, L.P.
View accessible version of this chart.
Until early 2021, the government was able to help fund itself by issuing debt at ultra-low interest rates. Now, with the post-pandemic surge in inflation and the commensurate monetary policy response by the Federal Reserve (Fed), the government’s ongoing ability to service its debt at higher interest rates is in question (Figure 2).
Figure 2 . CBO Historical and Projected Net U.S. Interest Payment Outlays as a % of GDP
Interest payments are expected to increase dramatically relative to history
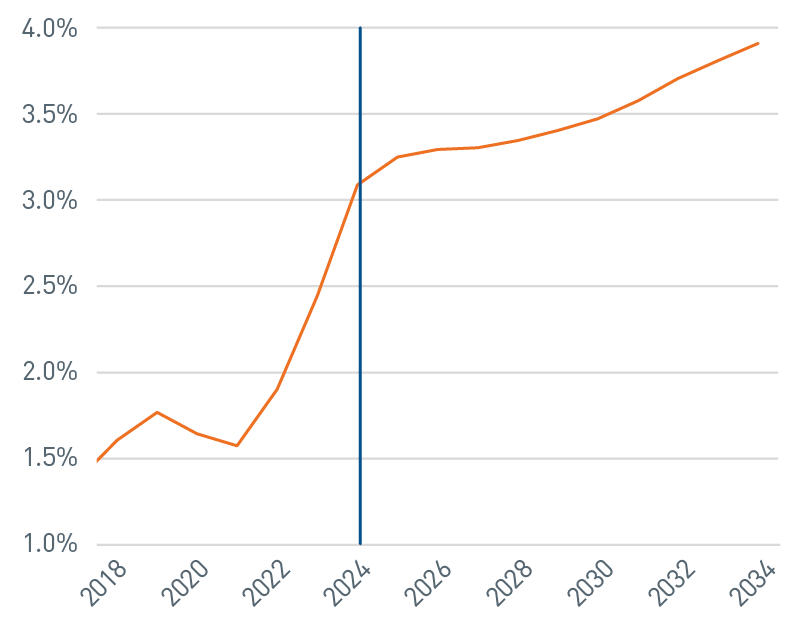
As of 2/7/2024. Source: CBO
View accessible version of this chart.
Increasing debt and deficits are not unique to the U.S., they are a global phenomenon. Indeed, other governments have faced additional outlays — again due to the global financial crisis, pandemic and other episodic spending bursts — that were not offset with a correspondent increase in revenue amid lower structural growth.
In our view, the U.S. is in a relatively better place to service and honor its debt obligations, reflected by its continued investment grade credit rating. Furthermore, the U.S. dollar remains the dominant global trading, financing and reserve currency power. From a broad perspective, we believe the U.S. also receives strong support from its deep capital markets, consistent innovation and attraction of talent and investment flows toward its dynamic economy.
Financial market implications
Financial market demand for U.S. government debt has strong support due to the elevated yield environment, with a range of implications for both equity and fixed income investors. As yields have risen, previous buyers and sources of demand for U.S. debt, such as foreign holders and the Fed (as part of quantitative easing), have been displaced by buyers that are more price-sensitive and distributed along the yield curve. Demand for shorter-maturity debt has increased among investors, after more than a decade at near-zero yields. The U.S. Treasury has obliged demand for short-term securities with increased supply. Likewise, demand for longer-maturity debt has also increased. Institutional investors, such as insurance companies and pension funds, now have greater flexibility to invest in longer-maturity debt to match their expected future liabilities, which reduces their need to take as much risk as in the past, whether it be in equity markets or high yield fixed income.
Given the increased focus on funding the nation’s deficit, this growing body of more price-sensitive investors has drawn increased attention to the U.S. Treasury’s quarterly refunding announcements. As markets try to anticipate what yields will clear the expected demand for U.S. government securities, it has added volatility to what was a routine exercise in the past. In addition to increased volatility, expectations for higher debt issuance to cover the growing deficit are placing upward pressure on the term premium — the added compensation investors expect for the unknowns associated with holding longer-term debt — and thus, further driving up yields.
One potential effect we remain aware of is whether higher yields on government securities will “crowd out” corporate debt issuers, forcing them to increase the yields on debt they issue to finance themselves. This is not currently the case as corporate credit is trading at tight spreads compared to historical levels. Corporate issuers have been aided by solid fundamentals, but also by the fact that they provide elevated all-in yields compared to recent history.
The bottom line
As we get closer to Election Day and the January 2025 debt ceiling expiration, we expect more noise related to the debt and deficit; however, we believe any effects will be short-lived. As our investment process is biased toward long-term investment horizons, the U.S. deficit and debt balance have yet to influence our asset allocation positioning.
Accessible Version of Charts
Figure 1: U.S. Federal Budget Surplus/Deficit (% of GDP)
The deficit is on par with levels typically seen during recessions
Date |
US Treasury Federal Budget Yearly Total Surplus/Deficit (% GDP) |
40-Yr Average |
U.S. Recession |
4/30/2023 |
-7.2% |
-3.8% |
No |
4/30/2022 |
-4.7% |
-3.8% |
No |
4/30/2021 |
-15.4% |
-3.8% |
No |
4/30/2020 |
-9.7% |
-3.8% |
Yes |
4/30/2019 |
-4.3% |
-3.8% |
No |
4/30/2018 |
-3.4% |
-3.8% |
No |
4/30/2017 |
-3.0% |
-3.8% |
No |
4/30/2016 |
-2.7% |
-3.8% |
No |
4/30/2015 |
-2.5% |
-3.8% |
No |
4/30/2014 |
-2.8% |
-3.8% |
No |
4/30/2013 |
-5.1% |
-3.8% |
No |
4/30/2012 |
-7.1% |
-3.8% |
No |
4/30/2011 |
-8.8% |
-3.8% |
No |
4/30/2010 |
-9.4% |
-3.8% |
No |
4/30/2009 |
-7.7% |
-3.8% |
Yes |
4/30/2008 |
-1.6% |
-3.8% |
Yes |
As of 1/31/2024. Source: Bloomberg, L.P.
Figure 2: CBO Historcal and Projected Net U.S. Interest Payment Outlays as a % of GDP
Interest payments are expected to increase dramatically relative to history
Date |
CBO Historical and Projected Net U.S. Interest Payment Outlays |
12/31/2034 |
3.9 |
12/31/2032 |
3.7 |
12/31/2030 |
3.5 |
12/31/2028 |
3.3 |
12/31/2026 |
3.3 |
12/31/2024 |
3.1 |
12/31/2022 |
1.9 |
12/31/2020 |
1.6 |
12/31/2018 |
1.6 |
As of 2/7/2024. Source: CBO.