
Revisión del mercado
La marcha errática del mercado bursátil concluye donde empezó
En noviembre, las acciones globales cerraron prácticamente sin cambios tras recuperarse de un retroceso a mediados del mes. El índice S&P 500® logró cerrar el mes con un rendimiento del 0.1 %, tras una caída del 4.5 % a mediados de mes, marcando así su séptimo retorno mensual positivo consecutivo. Las acciones asociadas al desarrollo de la inteligencia artificial (IA) se rezagaron este mes, con los índices Nasdaq Composite y MSCI de Mercados Emergentes registrando rendimientos negativos, lo que atenúa el sobresaliente desempeño de este año por parte de las compañías globales de IA. En noviembre, las especulaciones en torno a las políticas de tasas de interés de la Reserva Federal jugaron un papel determinante en las fluctuaciones del mercado, lo que contribuye tanto a la retracción inicial como al posterior repunte. Se registraron fluctuaciones significativas en los precios de los futuros de los fondos federales vinculados a un recorte de tasas en diciembre, el mes comenzó con una probabilidad superior al 90 %, y después cayó al 30 %, para finalmente recuperarse a niveles muy cercanos a la certeza(Figura 1). Asimismo, el sentimiento de los inversionistas fluctuó a lo largo del mes, en torno a la esperanza de un recorte en las tasas y las consideraciones sobre la IA.
Figura 1. Expectativas de recorte de la tasa de futuros de fondos federales 10 de diciembre para la reunión del Comité Federal de Mercado Abierto
La probabilidad de un recorte en la tasa de la Fed varió significativamente en noviembre
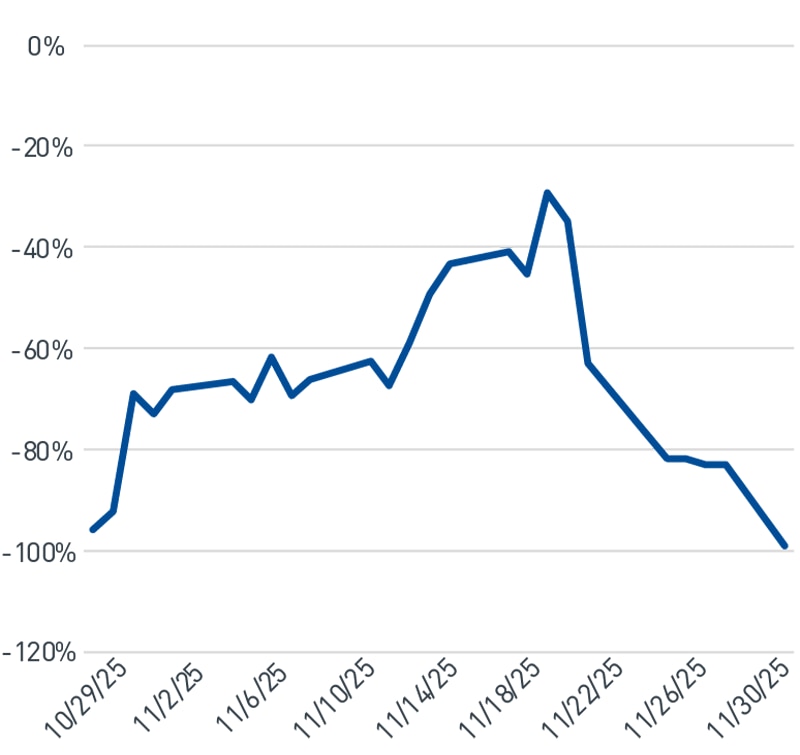
Al 12/01/2025. Fuente: Bloomberg L.P.
Ver la versión accesible de este gráfico.
Tema del mes
La IA sigue siendo el factor clave para impulsar el avance de los mercados financieros
A medida que se aproxima el final de la temporada de resultados del tercer trimestre, el S&P 500 ha logrado hasta ahora otro trimestre sólido, con una tasa de crecimiento de utilidades del 13.4 %, por encima de lo anticipado por el consenso. Las acciones del grupo de los Siete Magníficos (Mag 7), que incluyen a hiperescaladores y compañías esenciales para la innovación de IA, registraron un crecimiento de utilidades del 18.4 %, mientras que el sector de Tecnologías de la Información informó un crecimiento de ganancias del 28.5 %, de acuerdo con datos de FactSet®, resultados alineados con las tendencias proyectadas para 2025 (Figura 2).
Figura 2. Crecimiento de ganancias por trimestre en 2025
Las grandes compañías tecnológicas siguen sustentando el aumento en las ganancias del S&P 500
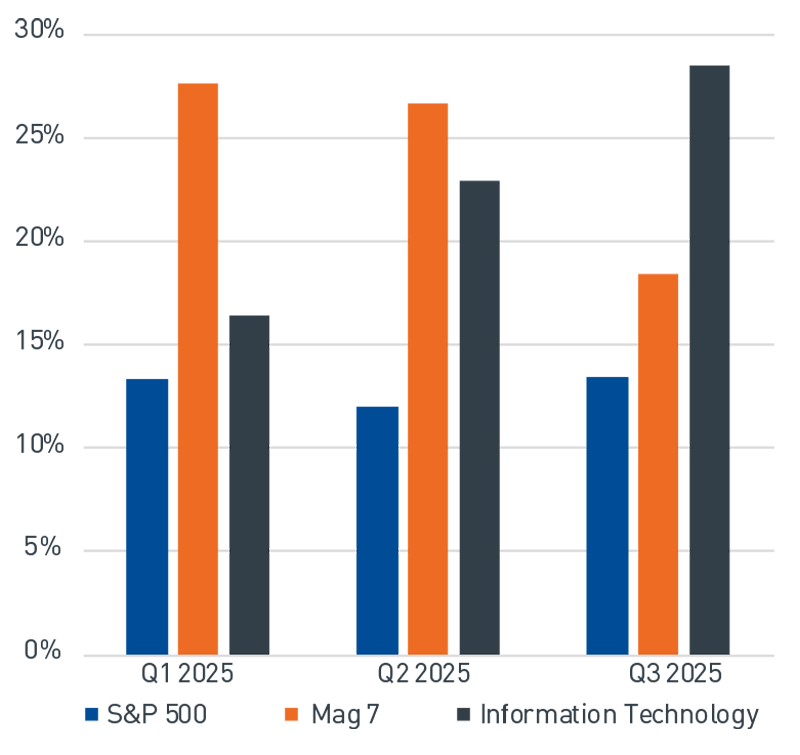
A partir del 11/30/2025. Fuente: Bloomberg L.P.
Ver la versión accesible de este gráfico.
Consideramos que las valoraciones de las compañías Mag 7 se mantienen dentro de los rangos históricos y no muestran señales de una excesiva especulación en el mercado. De acuerdo con datos de Bloomberg, la relación precio a ganancias (P/E) agregada de 39.9 está apenas por debajo del promedio de los últimos diez años de 40.2. En términos de la relación precio a ganancias (P/E) proyectada, el grupo cotiza con un múltiplo 15 veces inferior al máximo alcanzado en 2020.
Seguimos considerando que estas empresas mantienen valoraciones elevadas debido a su crecimiento de ganancias relativamente superior y modelos de negocio robustos, así como por sus economías de escala en comparación con el resto del mercado. La valoración del sector tecnológico, en términos generales, se mantiene alrededor de un 40 % por debajo del máximo alcanzado en el año 2000. En estos tiempos en que la inflación y los costos de endeudamiento siguen siendo un obstáculo para varias industrias, los innovadores en IA pueden sortear dicha problemática debido a la magnitud y alcance de sus operaciones comerciales.
Además, la mayoría de las compañías conocidas como las Siete Magníficas reportaron proyecciones sólidas para 2026 y reafirmaron o incrementaron sus estimaciones de gastos de capital. Según datos de FactSet, se prevé que el gasto de capital de los hiperescaladores seguirá aumentando, aproximándose a los 500 mil millones de dólares estimados para 2026, tras un año récord en 2025, como parte del desarrollo de infraestructura de IA. La expansión ha sido financiada principalmente mediante efectivo o deuda de empresas rentables con estructuras financieras robustas, una diferencia importante respecto a la burbuja tecnológica de los años noventa.
La construcción de centros de datos para respaldar la tecnología de IA ha fomentado una innovación continua, y durante el último mes seguimos viendo nuevos avances. Alphabet Inc. anunció recientemente el lanzamiento de su último modelo de lenguaje de gran tamaño (LLM), Gemini 3, el cual, según informes, ha superado a los modelos competidores mediante el uso de chips semiconductores propios. Amazon.com, Inc. recaudó 15,000 millones de dólares mediante una emisión de bonos que se destinarán principalmente a la expansión de su infraestructura de IA, así como al desarrollo de su propio chip de IA. El gigante del comercio electrónico Grupo Alibaba lanzó una nueva aplicación de asistencia al consumidor basada en IA que se ha convertido en una de las aplicaciones de más rápido crecimiento en China. Esta capacidad de realizar inversiones considerables respalda nuestra expectativa de que las grandes compañías tecnológicas seguirán siendo líderes en innovación en IA, con una competencia saludable que promoverá más avances.
Consideramos que los recientes anuncios relacionados con la adopción e innovación de la IA deberían acelerarse a partir de 2026 y en adelante. Varias de las grandes compañías tecnológicas que impulsan la inversión, especialmente en Estados Unidos y China, mantienen una sólida posición financiera. Se anticipa que las considerables inversiones en IA realizadas por estas empresas continúen y se transformen de un impulsor de crecimiento a un facilitador de productividad. Aunque la “vigilancia de burbujas especulativas” probablemente seguirá siendo un pasatiempo para los inversionistas, anticipamos que los altibajos constituirán un componente saludable del ciclo de innovación en IA, que, en términos generales, continúa fortaleciéndose.
VERSIÓN TEXTUAL DE LOS GRÁFICOS
Figura 1. Expectativas de recortes en la tasa de futuros de fondos federales para la reunión del Comité Federal de Mercado Abierto 10 de diciembre (ver imagen)
La probabilidad de reducción de la tasa de la Fed varió significativamente en noviembre
| Fecha | Probabilidad de reducción/aumento de las tasas |
| 12/01/2025 | -99 % |
| 11/27/2025 | -83 % |
| 11/25/2025 | -82 % |
| 11/21/2025 | -63.10 % |
| 11/19/2025 | -29.30 % |
| 11/17/2025 | -41 % |
| 11/13/2025 | 49.50 % |
| 11/11/2025 | -67.30 % |
| 11/07/2025 | -66.20 % |
| 11/05/2025 | -61.90 % |
| 11/03/2025 | -66.50 % |
| 10/30/2025 | -72.90 % |
| 10/28/2025 | -92.30 % |
Al 12/01/2025. Fuente: Bloomberg L.P.
Figura 2. Crecimiento de ganancias por trimestre en 2025 (ver imagen)
Las grandes compañías tecnológicas siguen sustentando el aumento en las ganancias del S&P 500
| Primer trimestre de 2025 | Segundo trimestre de 2025 | tercer trimestre de 2025 | |
| S&P 500 | 13.34 % | 11.96 % | 13.40 % |
| 7 Mag | 27.64 % | 26.61 % | 18.40 % |
| Tecnología de la información | 16.38 % | 22.93 % | 28.50 % |
| S&P 500 | 13.34 % | 11.96 % | 13.40 % |
A partir del 11/30/2025. Fuente: Bloomberg L.P.