


EVALUACIÓN DE LA SALUD FINANCIERA DEL CONSUMIDOR | NOVEMBER 2026
Are higher prices finally catching up to consumers?
Consumer resilience persists, but pressures are building

Por Brian LeBlanc
Director de análisis económico, Investigación económica de PNC
Nota del economista
Spending remains solid but momentum is slowing, with households relying more on credit cards.


Are higher prices finally catching up with consumers?
Consumer spending has remained remarkably resilient in 2026. Despite rapid increases in gasoline prices, ongoing affordability concerns, above-trend inflation, and higher interest rates, spending actually accelerated through the first half of the year. As we've written about previously, this resilience likely reflects two main factors. First, household balance sheets were very healthy entering the year, providing room to absorb these shocks. Second, larger tax refunds in the spring helped shelter consumers from the impact of higher prices.
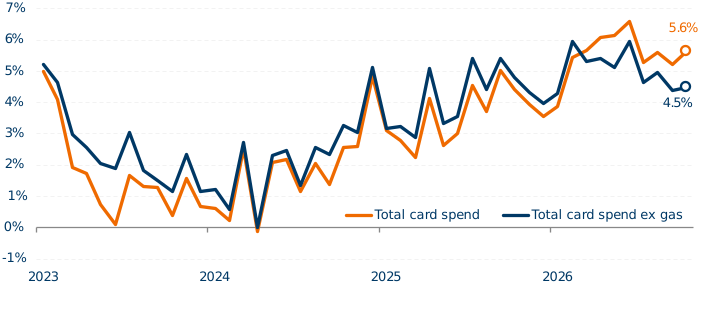
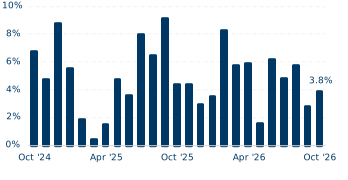
Spending remained solid on a seasonally adjusted year-over-year (YoY) basis in October, with total card spending increasing 5.6% YoY and 4.5% excluding gasoline. However, momentum has been weaker in recent months. Card spending outside of gasoline has increased at only a 3.8% annualized pace over the past three months, barely enough to keep pace with inflation.
Figura 1: YoY percentage change in combined debit and credit card spending, seasonally adjusted
Fuente: Datos internos de PNC
Nota: Seasonally adjusted by PNC. Growth is the year-over-year percentage change in monthly seasonally adjusted spending.
Figura 2: Card spending excluding gas: 3-month annualized growth
Fuente: Datos internos de PNC
Nota: Combined debit and credit card spending, seasonally adjusted
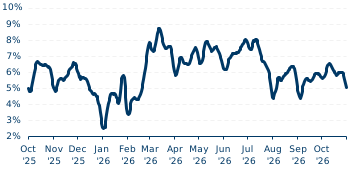
Figura 3: YoY growth rate of daily card spending on discretionary items
Fuente: Datos internos de PNC
Nota: 28D moving average
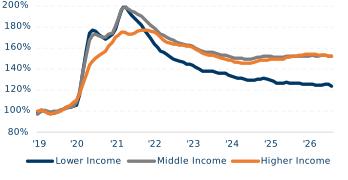
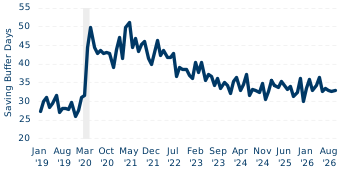
So, is the impact of higher prices finally catching up with consumers? We think the evidence is mixed. For one, household balance sheets remain very healthy by historical standards. Average checking and savings balances remain elevated even after accounting for inflation, median savings buffers remain stable, and the percentage of households living "paycheck-to-paycheck" has not increased in 2026.
Figura 4: Mediana de los saldos de depósitos en cuentas de cheques y de ahorros, ajustada por inflación, como porcentaje de los niveles de 2019 (media móvil de 3 meses)
Fuente: Datos internos de PNC
Nota: Chart shows data seasonally adjusted by PNC and deflated using PCE price index, 3-month moving average (3M MA)
Figura 5: Median days of household savings buffers
Fuente: Datos internos de PNC
Nota: Chart shows the number of days households can maintain current spending using existing cash balances if no new income comes in.
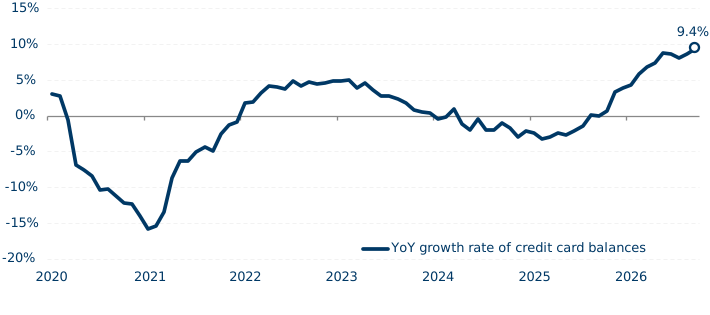
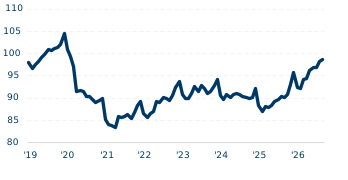
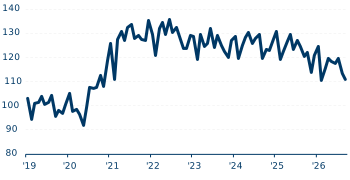
On the other hand, there is evidence that households are relying more heavily on credit cards to sustain spending. To be clear, credit card balances per active account remain low, but they have increased by more than 9% over the past year, the fastest pace since before the pandemic. Additionally, the fraction of balances being paid off each month has steadily declined through 2026.
Figura 6: Credit card balances are increasing at the fastest pace since before the pandemic
Fuente: Datos internos de PNC
Nota: Chart shows the YoY growth rate of credit card balances per active account. Latest available data septiembre de 2026.
Figura 7: Credit card balance per active account, 2019 = 100
Fuente: Datos internos de PNC
Nota: Chart shows the average credit card balance per active account. Latest available data is septiembre de 2026
Figura 8: Index of credit card balances paid off each month, 2019 = 100
Fuente: Datos internos de PNC
Nota: Chart shows the proportion of outstanding credit card balances that are being paid off each month per active account. Latest available data septiembre de 2026.
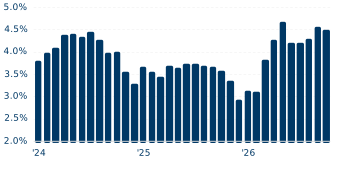
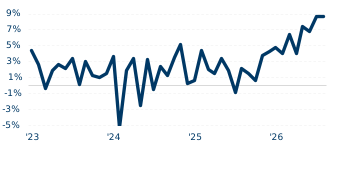
We're also seeing some evidence of inflation fatigue in the composition of consumer spending. Gasoline has accounted for an increasing share of spending as prices have risen, while spending growth at discount retailers and wholesale clubs has accelerated markedly.
Figura 9: Percent of total card spend on gasoline
Fuente: Datos internos de PNC
Nota: Monthly nominal spending; not seasonally adjusted.
Figura 10: Card spend at discount stores
Fuente: Datos internos de PNC
Nota: Monthly year-over-year growth, nominal, not seasonally adjusted.
The consumer divide is increasingly generational
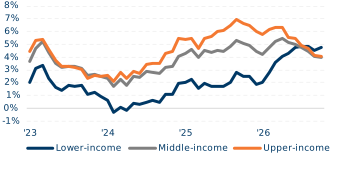
For much of the past few years, the focus has been on the large K-shaped divergence between lower- and upper-income households. The effects of high inflation and a weakening labor market disproportionately fell on lower-income households, whose spending growth stagnated for much of the 2023 to 2025 period. However, that K-shaped pattern has reversed in 2026, with lower-income household spending growth improving considerably and closing the gap with upper-income households.
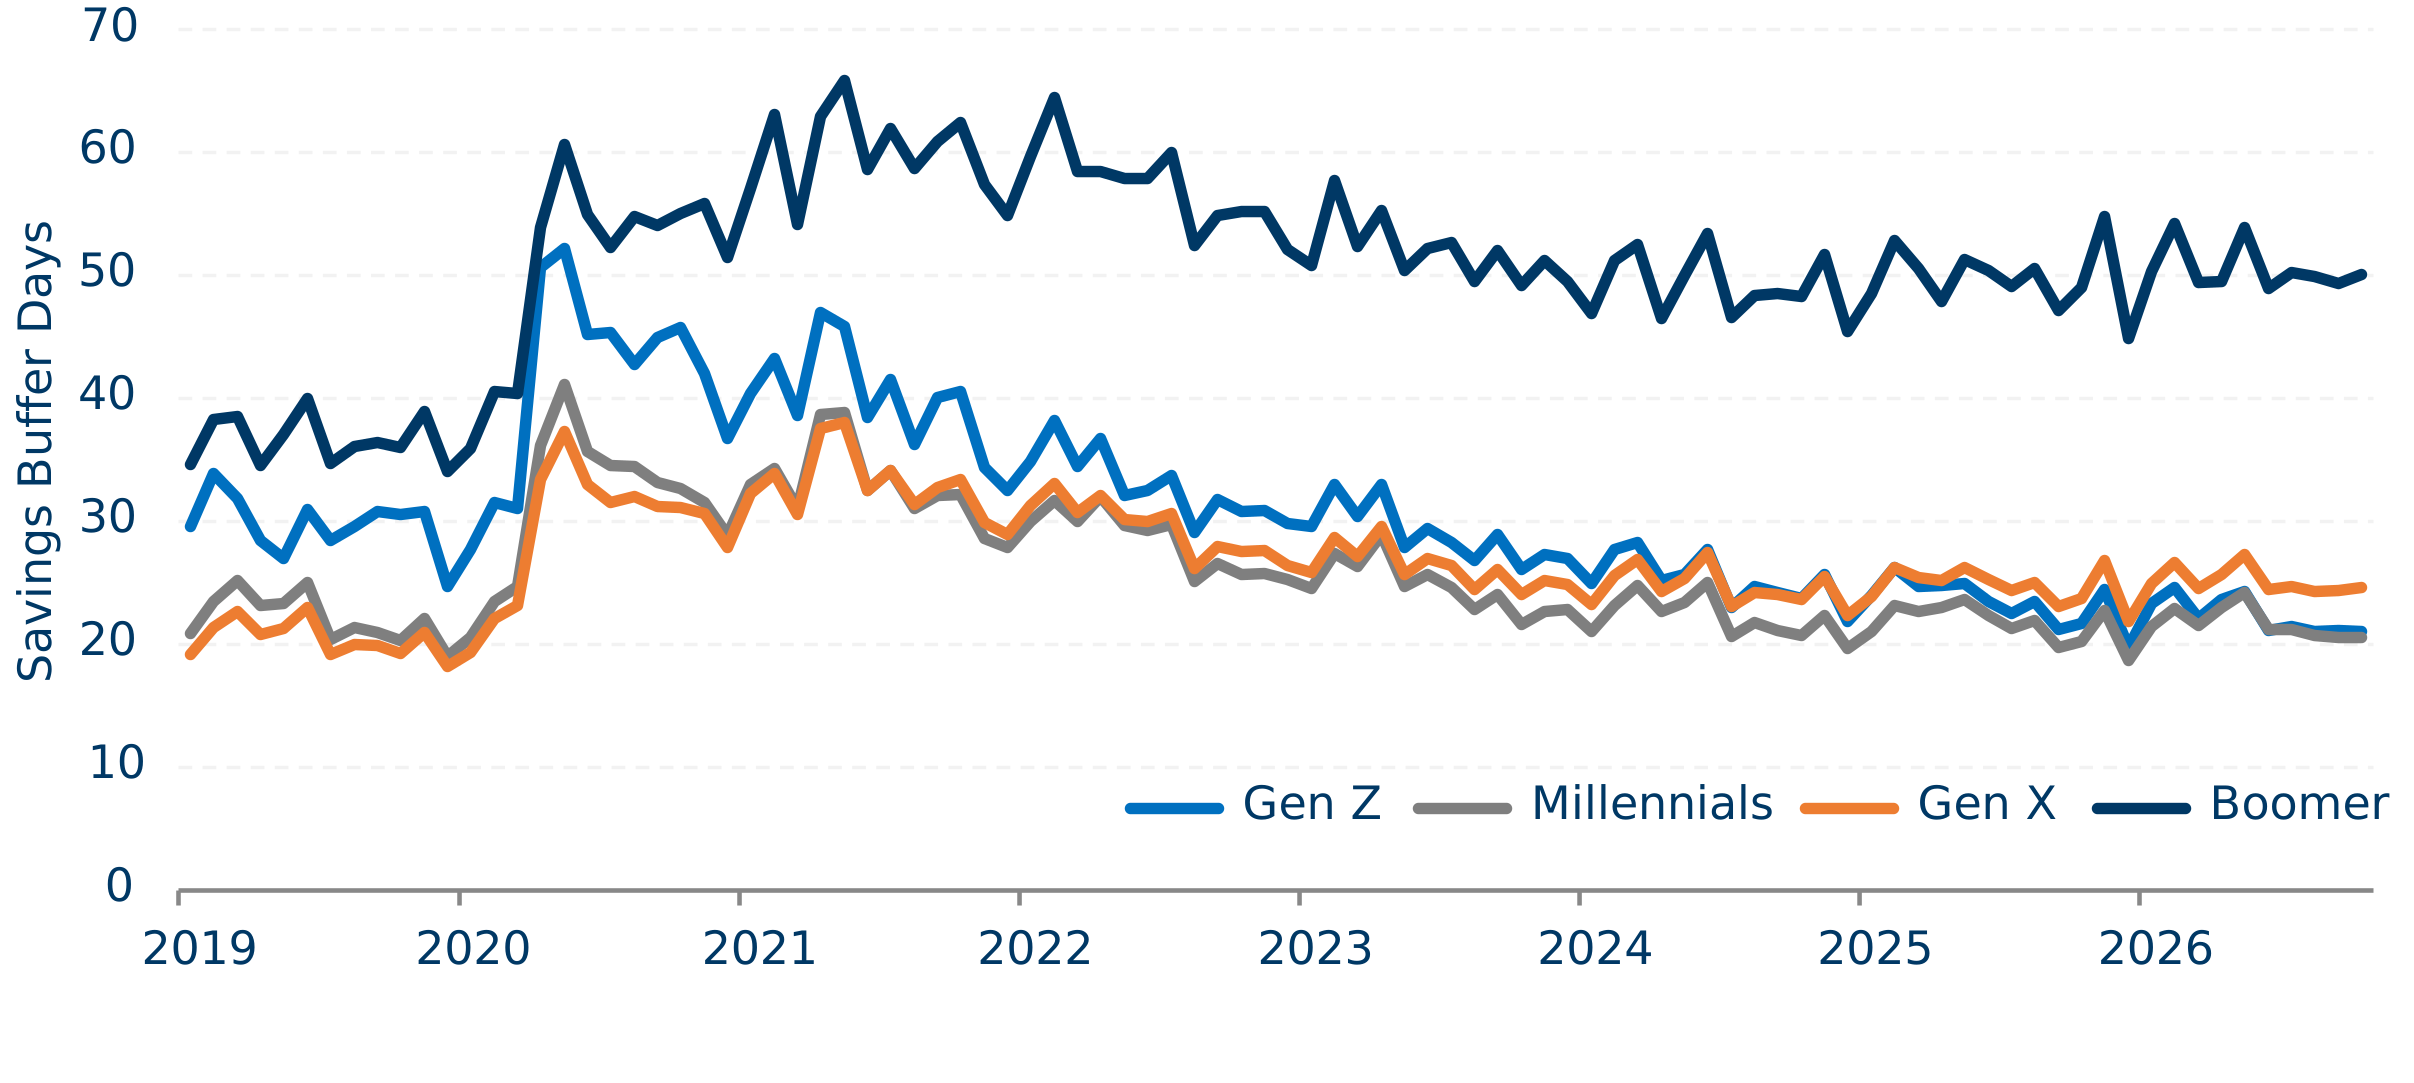
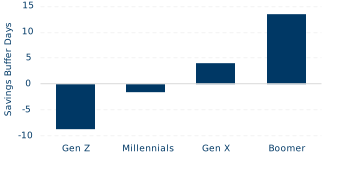
But the narrowing of the income gap does not mean that the financial divide among consumers has disappeared. Instead, it appears to be increasingly generational. Older households, particularly Boomers, have benefited considerably from the large increase in household net worth since the pandemic. Their cash savings remain well above pre-pandemic levels, while savings buffers for younger households have declined much further in recent years.
Figura 11: Household savings buffers by generation (higher = larger savings buffers)
Fuente: Datos internos de PNC
Nota: Chart shows the number of days households can maintain current spending using existing cash balances if no new income comes in.
Figura 12: Household savings buffers by generation, change versus 2019 averages
Fuente: Datos internos de PNC
Nota: Chart shows the number of days households can maintain current spending using existing cash balances if no new income comes in relative to 2019 averages.
Figura 13: YoY percent change in card spend ex. gas by income
Fuente: Datos internos de PNC
Nota: Growth is computed as the year-over-year percentage change in the three-month moving average of the seasonally adjusted level.
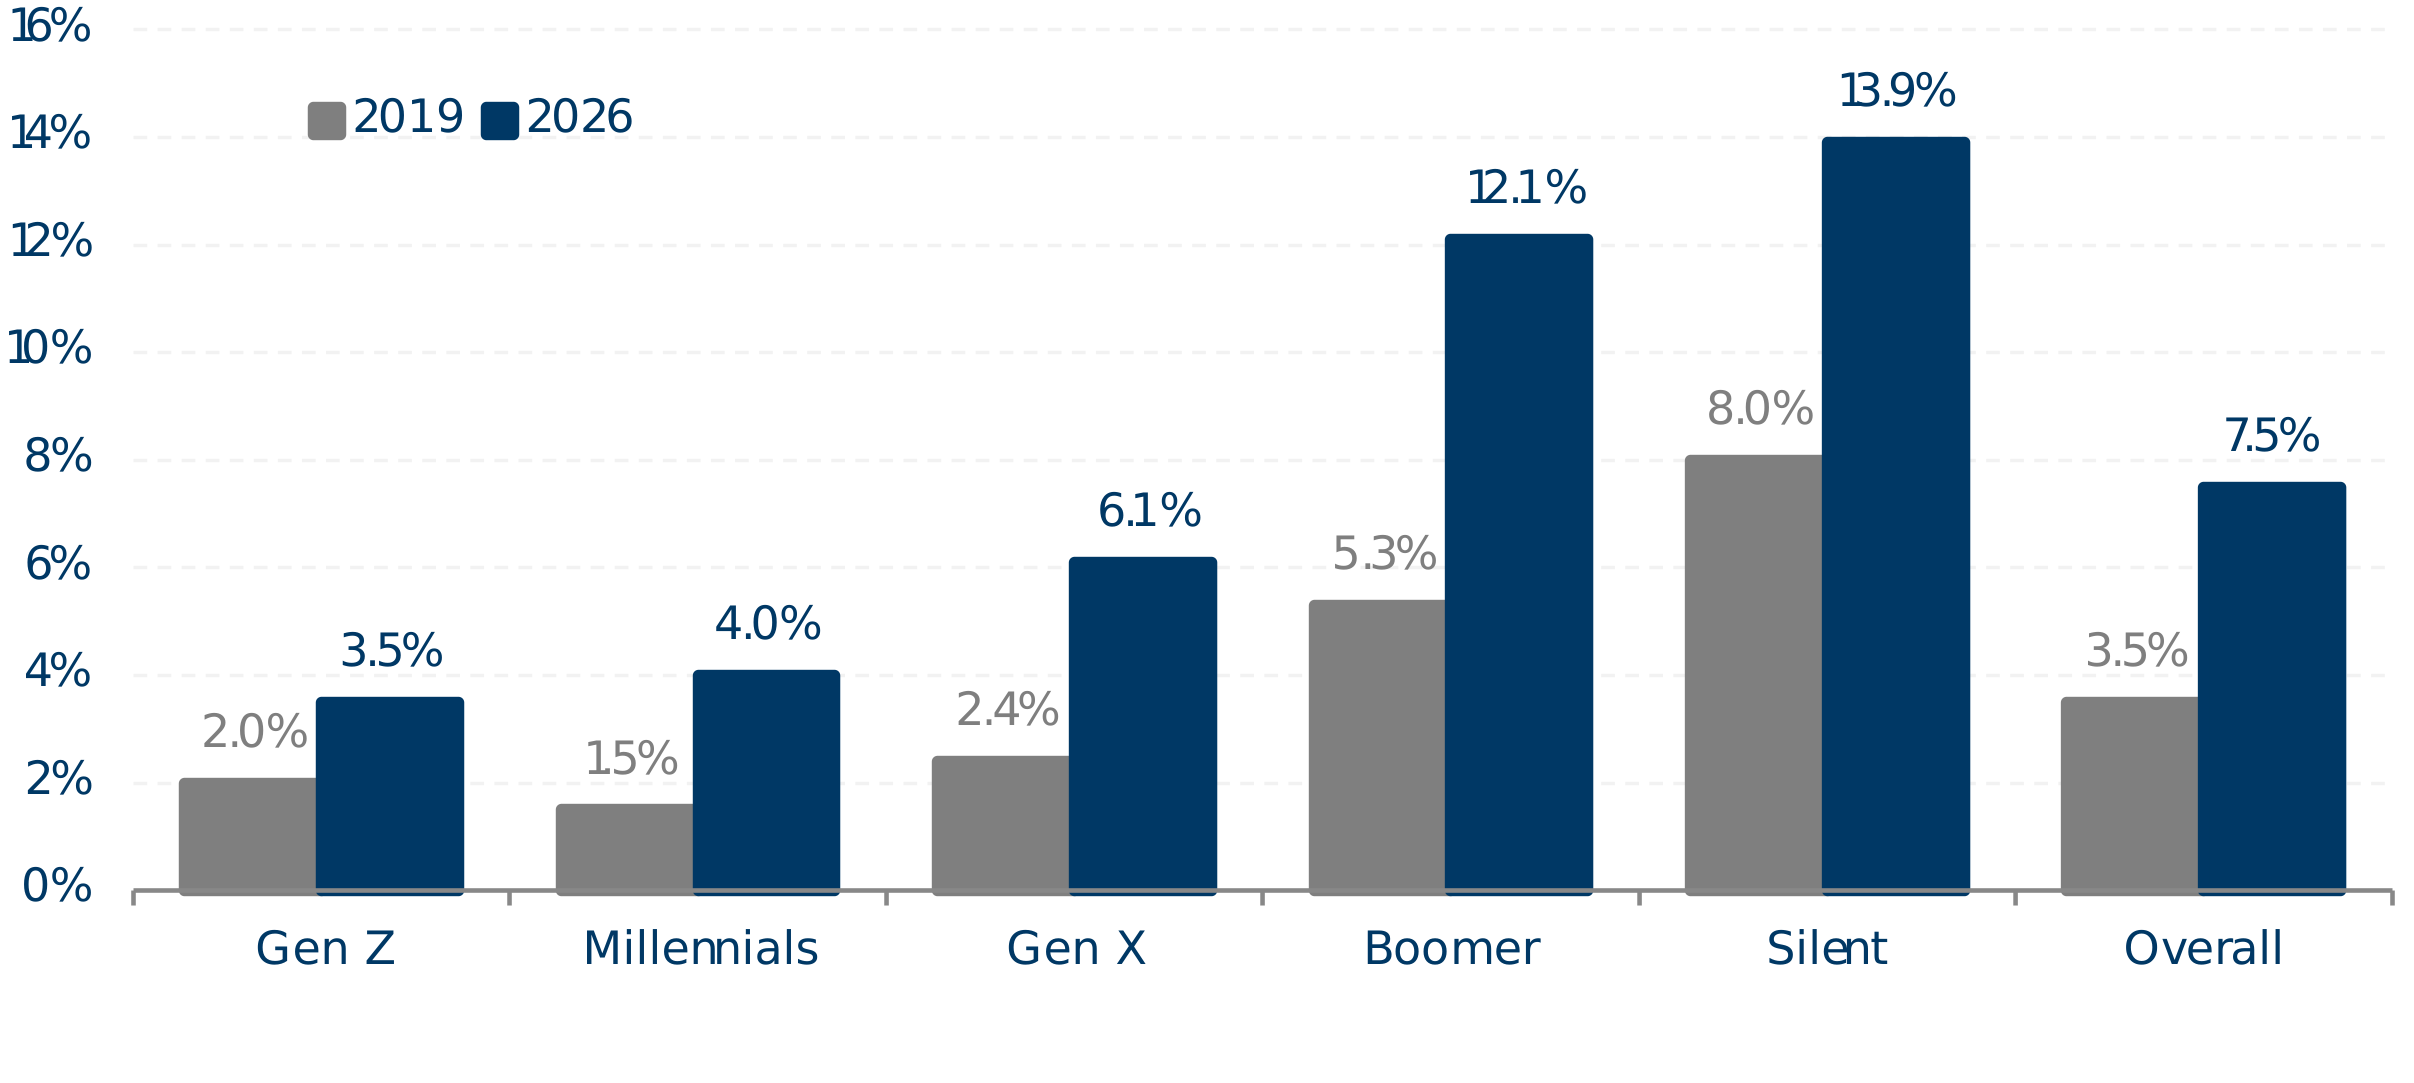
The divide extends beyond cash savings. Boomer households also carry considerably less debt and are seeing substantial net inflows from investment accounts into their checking accounts, providing another source of liquidity following the large increase in equity markets in recent years. Net inflows from investment and brokerage accounts are now equivalent to roughly 12% of Boomer card spending, more than twice the share in 2019.
Figura 14: Inflows from investment accounts as a share of total spend by generation, 2019 vs. 2026
Fuente: Datos internos de PNC
Nota: Shows the ratio of net inflows from investment accounts to total spending over the period from January to October.
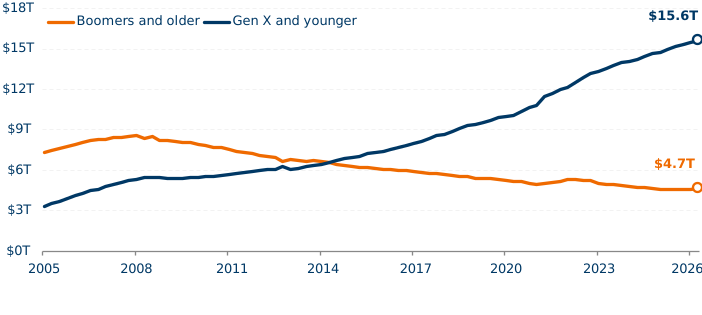
Figura 15: Total household debt outstanding, Boomers and older vs. Gen X and younger
Fuente: Federal Reserve Distributional Financial Accounts (latest data 2026:Q2)
Nota: Total household liabilities in trillions of nominal dollars. Boomers and older = born before 1965; Gen X and younger = born 1965 or later (includes Millennials and Gen Z).
More than 90% of gambling spend comes from just 10% of users
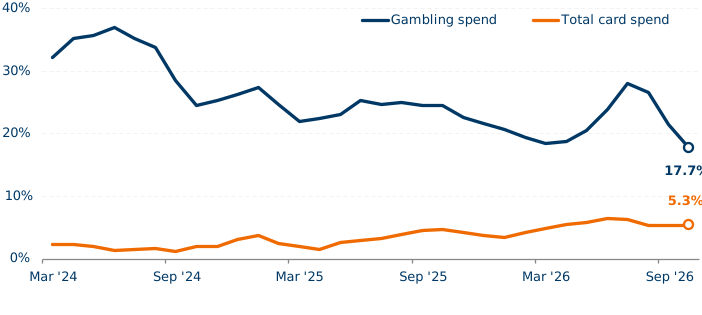
Gambling remains one of the fastest-growing areas of discretionary spending, increasing about 18% over the past year through October. However, the increase in gambling spending is coming from greater intensity rather than broader participation.
Figura 16: YoY percentage change in gambling spending vs. total card spending (3-month moving average)
Fuente: Datos internos de PNC
Nota: Not seasonally adjusted. YoY % change in 3-month moving average of monthly spending. Gambling = sports betting, prediction markets, and other gambling.
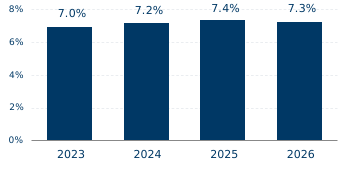
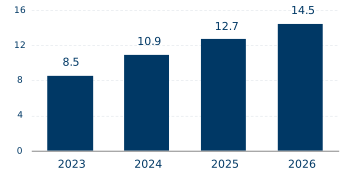
In PNC checking account data, an average of 7.3% of households had gambling or sports-betting activity in a month during January – octubre de 2026, compared with 7.0% in 2023. Instead, households that gamble are doing so much more frequently, with the average number of monthly transactions per active household increasing roughly 70% since 2023, coupled with only about a 5% increase in the average transaction size.
Figura 17: Share of households with gambling spend (gambling plus sports betting)
Fuente: Datos internos de PNC
Nota: Share of households with gambling or sports-betting spending in an average month, Jan–Oct of each year.
Figura 18: Monthly gambling transactions per active household
Fuente: Datos internos de PNC
Nota: Gambling and sports-betting transactions (card and ACH) per household with gambling activity, average month, Jan–Oct of each year.
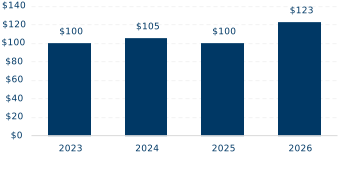
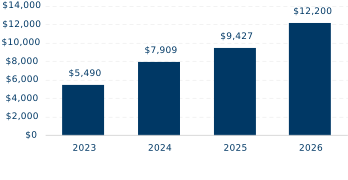
However, the real increase in gambling spending is coming from “super users.” The top 10% of gambling households account for more than 90% of total gambling spending and more than 90% of the increase in spending over the past year. Spending among these heavy users has also intensified considerably: median spending among households in the top 10% has more than doubled since 2023.
Figura 19: Median annual gambling spend for active gambling households
Fuente: Datos internos de PNC
Nota: Chart shows the median spend for the period running January through October for each year shown.
Figura 20: Median annual gambling spend of the top 10% of active gambling households
Fuente: Datos internos de PNC
Nota: Chart shows the median spend for the period running January through October for each year shown
Within gambling households, median non-gambling spending was lower in the highest gambling quartile than the third quartile in all four generations, with the largest difference among Boomers.
The category pattern differs by age. In the highest quartile, travel medians were 7%-19% higher for Gen Z, Millennials and Gen X than in the third quartile; dining medians were also slightly higher. Grocery and general-merchandise medians were lower in all four generations. Among Boomers, dining and travel medians were lower, too. From these comparisons, it does not appear that those spending the most on gambling are cutting back in other areas to fund gambling.
Figura 21: Category spending differences vary by generation
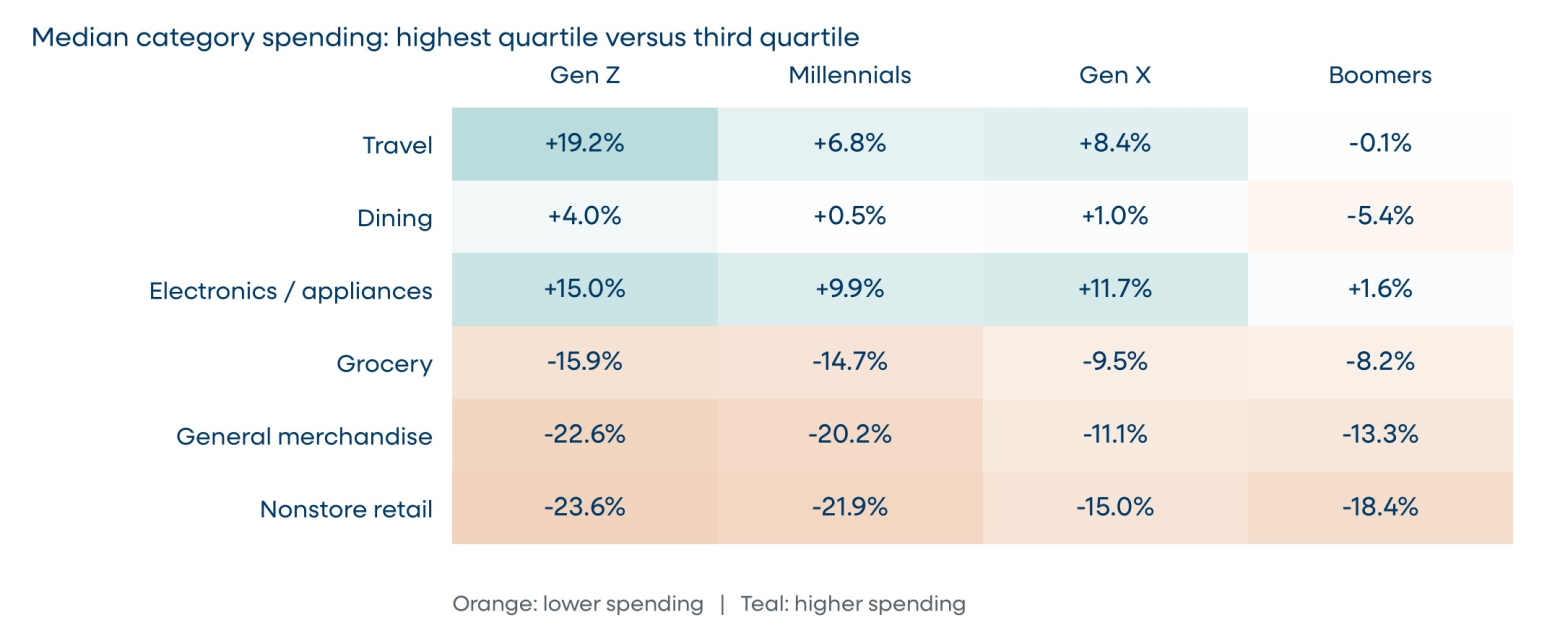
Fuente: PNC household transaction data, octubre de 2025-octubre de 2026 (13 months). Charts compare approximate medians in Q4 with Q3: 100 x (Q4 / Q3 - 1). Quartiles rank observed gambling-related amounts within each generation.
Gráficos y figuras clave
Indicador | Ene. 2026 | Feb. 2026 | Mar. 2026 | Abr. 2026 | May. 2026 | Jun. 2026 | Jul. 2026 | Ago. 2026 | Sep. 2026 | Oct. 2026 |
| Agregados clave | ||||||||||
Gasto total | 4.5 % | 5.3% | 5.0% | 6.3 % | 6.4 % | 6.6 % | 6.2 % | 3.6% | 6.3 % | 6.3 % |
Total (excluye gasolineras) | 5.2 % | 5.9 % | 4.6% | 5.6 % | 5.2 % | 6.1% | 5.7 % | 2.9 % | 5.3% | 5.2 % |
| Nivel sectorial | ||||||||||
Automoción | 4.9 % | 7.7% | 6.3 % | 7.6 % | 3.6% | 6.8 % | 5.2 % | 4.2 % | 7.7% | 6.8 % |
Restaurantes y bares | 3.5% | 3.9% | 0.4% | 3.1 % | 3.6% | 1.4 % | 3.7 % | 0.1 % | 2.7 % | 3.5% |
Tiendas de alimentos y bebidas | 3.0% | 0.4% | -0.8 % | -0.1 % | 1.1% | -1.4 % | 0.5 % | -3.6 % | -1.1% | -0.8 % |
Juegos de azar | 16.7 % | 12.9 % | 13.4% | 17.8% | 18.1 % | 22.6 % | 26.7% | 11.3% | 10.3 % | 13.2% |
Gasolineras y estaciones de servicio* | -6.0 % | -3.2 % | 12.0 % | 17.1% | 25.2% | 14.4% | 13.8% | 12.8% | 21.4% | 22.8% |
Hoteles | 0.2% | 2.1% | -0.1 % | 3.4% | 1.3 % | -1.0 % | 2.7 % | 0.5 % | 4.1 % | 1.0 % |
Ocio | 4.1 % | 5.1 % | 2.7 % | 5.6 % | 4.4% | 4.9 % | 3.6% | 2.6 % | 5.6 % | 4.0 % |
Servicios | 4.2 % | 6.4 % | 6.7 % | 6.7 % | 5.1 % | 8.2 % | 8.3 % | 6.3 % | 7.7% | 7.1% |
Viajes | 3.2% | 7.4 % | 6.7 % | 6.8 % | 6.4 % | 7.4 % | 7.7% | 5.9 % | 7.3% | 5.8% |
Comercio minorista - materiales de construcción, jardinería y suministros | 0.6 % | -3.0 % | -0.7 % | 6.0 % | -0.2% | 2.2% | 1.7 % | -1.2 % | 3.9% | 3.9% |
Comercio minorista - ropa y accesorios | 1.9 % | 4.5 % | 0.7 % | 1.9 % | 0.6 % | 1.2 % | 3.4% | -1.0 % | 4.1 % | 2.3 % |
Comercio minorista - electrónica y electrodomésticos | 11.3% | 11.1 % | 9.0 % | 7.3% | 10.6% | 11.7 % | 11.1 % | 11.3% | 14.3 % | 12.7 % |
Comercio minorista - muebles y artículos para el hogar | 3.5% | 3.8% | -0.6 % | 2.1% | 6.1% | 4.4% | 4.0 % | -0.1 % | 7.6 % | -0.8 % |
Comercio minorista - tiendas de mercancías generales | 4.7 % | 4.6% | 3.7 % | 4.9 % | 7.5 % | 6.0 % | 7.3% | 6.3 % | 7.8 % | 9.0 % |
Comercio minorista - salud y cuidado personal | -1.2 % | 1.4 % | 4.8% | 2.1% | 3.0% | 5.8% | 7.0 % | 6.3 % | 7.0 % | 8.2 % |
Comercio minorista - tiendas minoristas diversas** | 9.9 % | 9.5 % | 6.9% | 8.9 % | 7.5 % | 9.3% | 10.9 % | 5.5 % | 7.5 % | 9.7 % |
Comercio minorista - minoristas sin tiendas físicas | 3.1 % | 7.1% | 3.7 % | 3.2% | 3.3 % | 13.1 % | -9.8 % | 0.4% | El 0.8 % | -0.1 % |
Fuente: Datos internos de PNC
Nota: La tabla detalla la variación porcentual interanual del gasto total con tarjeta por categoría (agregado) y no el gasto por hogar. Se omiten las categorías "transferencias de fondos" y "otros".
* “Gasolineras y estaciones de servicio” refleja el gasto total con tarjeta en comercios de estaciones de servicio y registra las compras de combustible junto con las ventas minoristas de conveniencia y los gastos secundarios relacionados con automóviles.
** “Comercio minorista - tiendas minoristas diversas” incluye el gasto en “artículos deportivos, libros, pasatiempos y música”.
Los datos se basan en selecciones agregadas y anonimizadas de información de PNC. Los datos pueden presentar cierto grado de sesgo de selección debido a las poblaciones seleccionadas y a la disponibilidad de la información.
- Las tendencias del gasto con tarjeta se basan en datos agregados de transacciones con tarjetas de débito y crédito de una cohorte fija de clientes minoristas. El gasto se clasifica mediante los códigos de categoría de comerciante estándar (MCC) definidos por las compañías de servicios financieros. Los datos de gasto también pueden agruparse utilizando otros métodos internos de propiedad exclusiva.
- El gasto en gasolina se limita a las compras realizadas mediante dispensadores automáticos de combustible, es decir, transacciones con tarjeta efectuadas directamente "en la bomba".
- Los datos de los saldos se agregan a partir de una cohorte fija de hogares que mantuvieron una cuenta de depósito de consumidor (cuenta de cheques, de ahorros o certificado de depósito) durante todos los meses desde enero de 2019 hasta el mes actual que se muestra.
- Los flujos de nóminas del consumidor, seguro de desempleo, devoluciones de impuestos y transferencias a cuentas de corretaje se basan en transferencias ACH y otros métodos de pago electrónico clasificados mediante metodologías internas de propiedad exclusiva.
- Las perspectivas de ingresos bajos, medios y altos se fundamentan en los ingresos estimados del hogar, calculados a partir de las transacciones de crédito hacia las cuentas de depósito del consumidor durante los últimos 12 meses. Los hogares se dividen en terciles: el tercio inferior se clasifica como de ingresos bajos, el tercio medio como de ingresos medios y el tercio superior como de ingresos altos. Los terciles de ingresos se actualizan periódicamente.
- Los días de reserva de ahorro miden el número de días que un hogar podría mantener su nivel de gasto actual al usar los saldos existentes en sus cuentas de cheques y de ahorros en caso de no recibir nuevos ingresos.
- Nuestra métrica de hogares que viven “al día” mide la relación entre los flujos de salida no relacionados con el ahorro de las cuentas de depósito del consumidor y los flujos totales de entrada a esas mismas cuentas. Los hogares cuyos flujos de salida mensuales son iguales o superiores al 90 % de sus flujos de entrada se clasifican como hogares que viven al día.
- Los datos de saldos de tarjetas de crédito y tasas de pago se basan en una cohorte fija de cuentas de tarjetas de crédito desde 2019 hasta el presente, y no representan la totalidad de la cartera de tarjetas de crédito de PNC.
- Consulte las notas debajo de los gráficos y tablas para obtener más detalles sobre la presentación de los datos. En ocasiones, se emplea una media móvil de 3 meses para garantizar resultados más uniformes.

Los archivos de Evaluación de la salud financiera del consumidor están disponibles.
El material presentado y las opiniones expresadas en el presente son de carácter general y no constituyen la provisión de asesoramiento de inversión o económico para ninguna persona, ni constituyen una recomendación con respecto a ningún título, instrumento financiero, estrategia o servicio bancario en particular. Las opiniones y los pronósticos expresados están sujetos a cambio sin previo aviso. La información pertinente se obtuvo de fuentes consideradas confiables. No se garantiza la precisión de dicha información. Debe asesorarse con un profesional de inversiones para que formule un plan financiero personalizado de acuerdo con sus necesidades. En la medida en que estos materiales hagan referencia a datos de PNC, dichos materiales no tienen la finalidad de reflejar o indicar los resultados de operaciones, la condición financiera ni el rendimiento de PNC y no deben tomarse como referencia para tal fin.
Las declaraciones a futuro necesariamente están sujetas a un gran número de supuestos, riesgos e incertidumbres, que cambian con el paso del tiempo. Los eventos o circunstancias futuras pueden cambiar nuestro panorama y también pueden afectar la naturaleza de los supuestos, riesgos e incertidumbres a los cuales están sujetas nuestras declaraciones a futuro. Las declaraciones a futuro corresponden únicamente a la fecha en que se realizan. No asumimos ningún deber ni emprendemos ninguna obligación de actualizar las declaraciones a futuro. Los resultados reales o los eventos futuros pueden variar, posiblemente de una manera sustancial, respecto de los resultados o eventos previstos en las declaraciones a futuro, así como respecto del rendimiento histórico. Como resultado, advertimos que no se debe considerar que las declaraciones a futuro sean definitivas.
“PNC” es una marca registrada de The PNC Financial Services Group, Inc.
© 2026 The PNC Financial Services Group, Inc. Todos los derechos reservados.