
Market Review
Stock market’s turkey trot ends where it began
In November, global equities finished mostly flat after reversing a mid-month pullback. The S&P 500® managed to end the month with a 0.1% return, after being down by 4.5% mid-month, and marked its seventh consecutive positive monthly return. Artificial intelligence (AI)-related growth stocks were the laggards of the month as the Nasdaq Composite and MSCI Emerging Market indices posted negative returns, tempering this year’s outperformance by global AI companies. Speculation about Federal Reserve interest rate policy moved markets in November, playing a role in both the pullback and subsequent rebound. There were significant fluctuations in the fed funds futures pricing tied to a December rate cut; the month began with a more than 90% likelihood, then fell as low as 30%, before rebounding to levels of near certainty (Figure 1). Likewise, investor sentiment oscillated during the month around hopes for a rate cut and sentiment about AI.
Figure 1. Fed Funds Futures Rate Cut Expectations for the December 10 Federal Open Market Committee Meeting
Fed rate cut probabilities swung widely in November
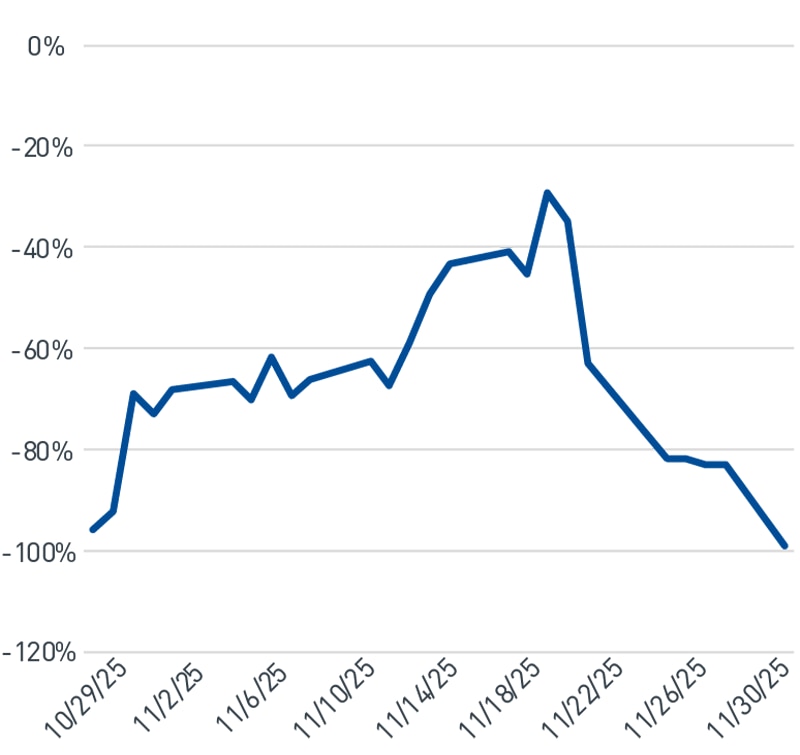
As of 12/1/2025. Source: Bloomberg L.P.
View accessible version of this chart.
Theme of the Month
AI still holds the keys to driving markets forward
As third quarter earnings season winds down, thus far, the S&P 500 has delivered another strong quarter with an above-consensus earnings growth rate of 13.4%. Magnificent 7 (Mag 7) stocks, which include hyperscalers and companies at the core of AI innovation, realized 18.4% earnings growth and the Information Technology sector reported 28.5% earnings growth according to FactSet® data – which is in line with 2025 trends (Figure 2).
Figure 2. 2025 Earnings Growth by Quarter
S&P 500 earnings growth is still supported by large technology companies
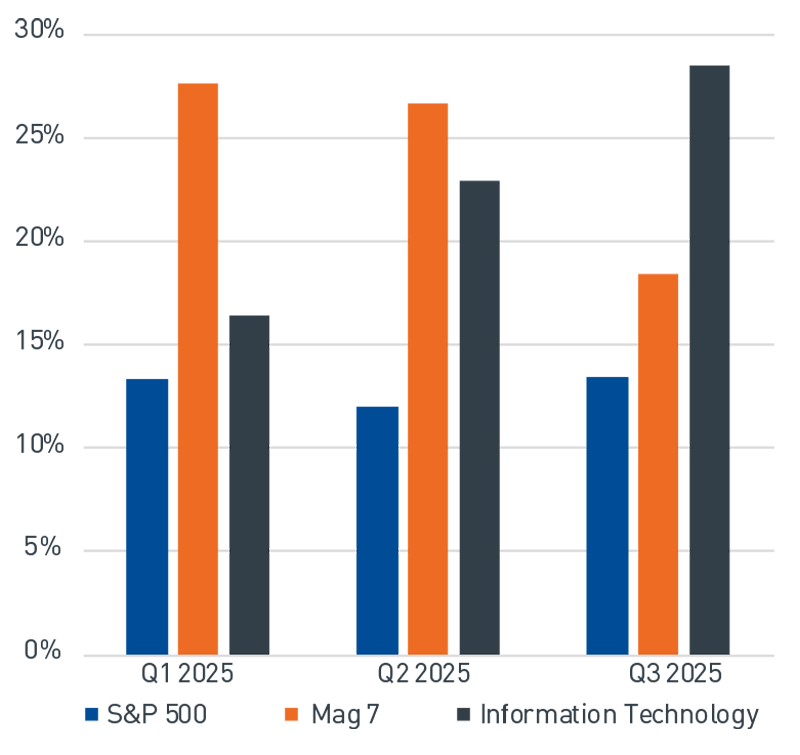
As of 11/30/2025. Source: Bloomberg L.P.
View accessible version of this chart.
We believe valuations for Mag 7 companies remain well within historical bands and do not indicate signs of excessive market froth. Their collective trailing price-to-earnings ratio (P/E) of 39.9 is slightly below the 10-year average of 40.2, according to Bloomberg data. On a forward P/E basis, the group is trading at a 15x lower multiple than the highs of 2020.
We continue to believe these companies trade at elevated valuations because of their relatively outsized earnings growth and robust business models, as well as economies of scale compared to the rest of the market. The valuation of the technology sector, broadly, remains approximately 40% below the peak reached in 2000. At a time when inflation and borrowing costs remain a headwind for many industries, AI innovators can deflect those issues given the size and scale of their businesses.
In addition, most Mag 7 companies reported solid guidance for 2026 and reaffirmed or raised their capital expenditure estimates. Hyperscaler capital spending is anticipated to continue to increase, approaching an estimated $500 billion in 2026 per FactSet data, after a record year in 2025 as part of the AI infrastructure buildout. The buildout has been funded mainly by cash or debt from profitable companies with fortress balance sheets, a major difference from the 1990s tech bubble.
Data center construction to support AI technology enables further innovation, and during the past month we continued to see new developments. Recently, Alphabet Inc. announced the release of its latest Gemini 3 large language model, which reportedly outperformed competing models using proprietary semiconductor chips. Amazon.com, Inc. raised $15 billion in a bond sale that will primarily fund further expansion of its AI infrastructure, in addition to developing its own AI chip. E-commerce giant Alibaba Group launched a new AI consumer assistant application (app) that has become one of the fastest growing apps in China. This ability to make sizable investments supports our expectation that large technology companies will remain the leaders in AI innovation, with healthy competition fostering further breakthroughs.
In our view, recent announcements related to AI adoption and innovation should accelerate in 2026 and beyond. Many of the large technology companies driving investment spending, especially in the United States and China, remain in strong financial positions. The significant investments in AI by these companies are expected to persist and evolve from a driver of growth into an enabler of productivity. While “bubble-watching” will likely remain an investor pastime, we expect ebbs and flows to be a healthy part of the AI innovation cycle, which, overall, is continuing to gain strength.
Figure 1. Fed Funds Futures Rate Cut Expectations for the December 10 Federal Open Market Committee Meeting (view image)
Fed rate cut probabilities swung widely in November
| Date | Rate Cut/Hike Probability |
| 12/1/2025 | -99% |
| 11/27/2025 | -83% |
| 11/25/2025 | -82% |
| 11/21/2025 | -63.10% |
| 11/19/2025 | -29.30% |
| 11/17/2025 | -41% |
| 11/13/2025 | 49.50% |
| 11/11/2025 | -67.30% |
| 11/7/2025 | -66.20% |
| 11/5/2025 | -61.90% |
| 11/3/2025 | -66.50% |
| 10/30/2025 | -72.90% |
| 10/28/2025 | -92.30% |
As of 12/1/2025. Source: Bloomberg L.P.
Figure 2. 2025 Earnings Growth by Quarter (view image)
S&P 500 earnings growth is still supported by large technology companies
| Q1 2025 | Q2 2025 | Q3 2025 | |
| S&P 500 | 13.34% | 11.96% | 13.40% |
| Mag 7 | 27.64% | 26.61% | 18.40% |
| Information Technology | 16.38% | 22.93% | 28.50% |
| S&P 500 | 13.34% | 11.96% | 13.40% |
As of 11/30/2025. Source: Bloomberg L.P.