

In the world of public defined benefit plans, negative net cash flow could have implications on the future health of a plan. Net cash flow refers to the balance of contributions less benefits and expenses:
Net Cash Flow = Contributions – Benefits – Expenses
If benefits and expenses are greater than contributions in a given year, the net cash flow is negative; if the contributions are greater than the benefits and expenses, then the net cash flow is positive. It is important to note here that investment returns do not factor into the equation for net cash flow. As such, while net cash flow can be an important indicator, it does not provide a comprehensive assessment of a given plan.
In this paper, we discuss the implications and insights that negative net cash flow can provide for a prototypical public defined benefit plan. From there, we will suggest generalized levers that plan sponsors can use to help increase the health of their plan and minimize any challenges caused by negative net cash flow.
Current Landscape
The funding status of public pension plans has been a frequent topic in the news in recent years. Looking at the actuarial funded ratio for state and local pension plans (Chart 1), the funded status of these plans have significantly declined over the last 15 years despite equities attaining all-time highs in recent periods. Though some of the reduction can be attributed to the impact of having two major market downturns during this period, we have seen that some plan sponsors have not been willing or able to contribute up to their actuarial requirements, which could help to bridge the gap during stressful market environments. Some headlines in recent years have captured how underfunded pensions can contribute to credit downgrades or even bankruptcies in states or municipalities. While the pension funding status is typically only a contributing factor in these events, the funding status nevertheless can have very real consequences.
Chart 1: Actuarial Funded Ratio for State and Local Pensions
View accessible version of this chart.
Source: Center for Retirement Research at Boston College
Changes in plan demographics have also been a concern as public plans have become more mature over time. Plans become more mature as participants age, retire, and start to collect payments from the plan. Public plans generally peg employer and employee contributions to the active population, meaning you will often see pension contribution requirements expressed as a percent of payroll. As more participants move from active to retiree status, combined with potentially larger underfunding, cash requirements as a percent of active employee payroll could increase significantly in order to fund these larger distributions.
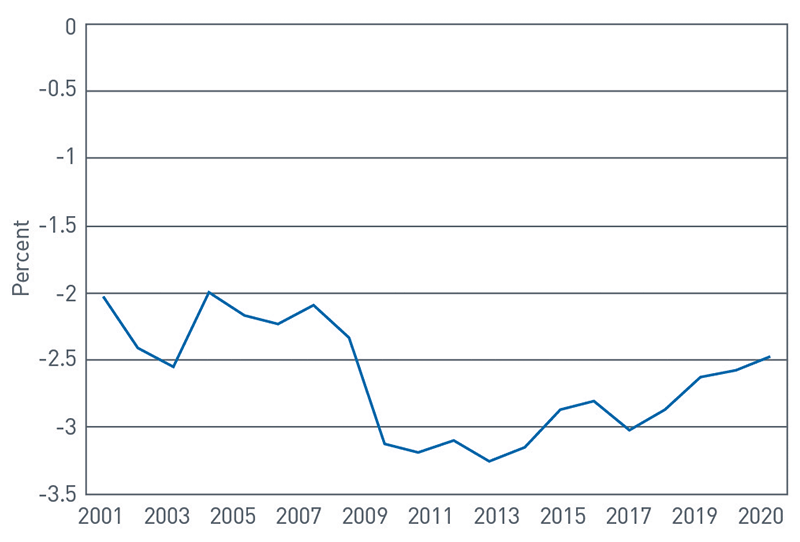
Chart 2 illustrates the extent to which plans have become more mature as the the ratio of actives to retirees has declined from approximately 2.5:1 down to below 1.5:1 in the last 15 years. We have no reason to believe that this trend will reverse in coming years. Furthermore, and partly resulting from the population dynamics, the average public plan has maintained a state of negative net cashflow (Chart 3) which remains around -2.5% of assets during this same period. For some some plan sponsors, especially those with underfunded or severely underfunded plans, this has the potential for significant financial consequences over the long term.
Chart 2: Number of Actives per Annuitant 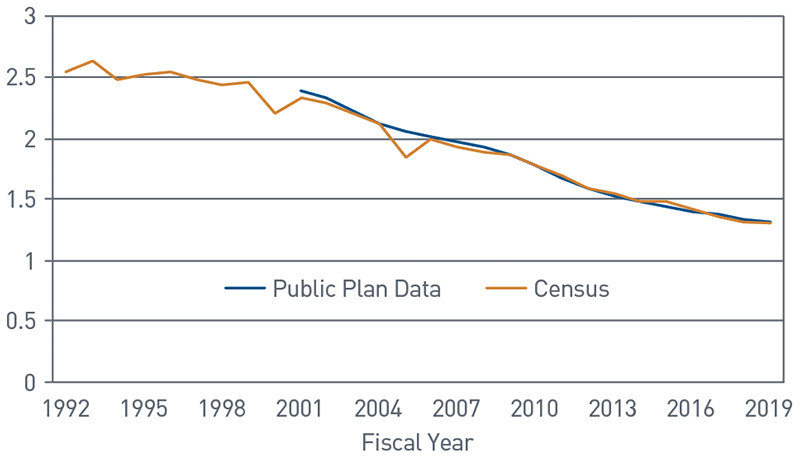
View accessible version of this chart.
Chart 3: Cash Flow as a Percentage of Assets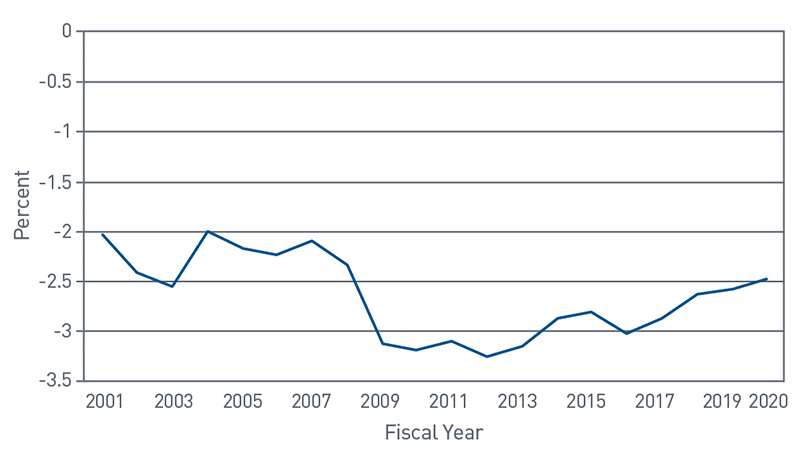
View accessible version of this chart.
Defining Negative Net Cash Flow Situations
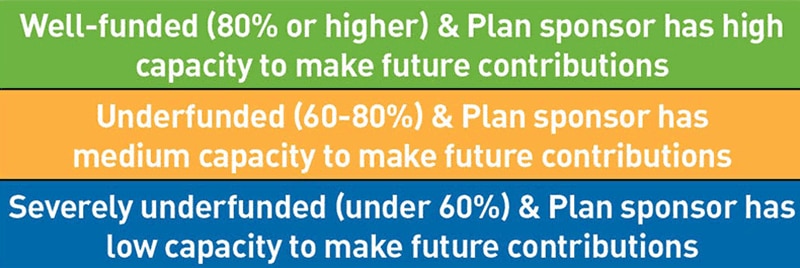
To help illustrate the spectrum of negative net cash flow as an indicator, the graphic in the next column indicates where negative net cash flow is possibly a red herring (green) to where it is possibly a red flag (blue). There are, at a minimum, two key indicators in the assessment: funding status and the capacity of the plan sponsor to make contributions in both the present and future. The funding status is easily determined as measured on actuarial reports, while the capacity of the plan sponsor to make contributions must take into account current and future positioning. One common measure that plan sponsors review is projected actuarial funding requirements relative to the size of the fiscal budget.
View accessible version of this chart.
Note: although we show three broad categories above to illustrate the range of outcomes, plan sponsors could fall in other categories not displayed depending on circumstances (for example, a municipality that has low capacity to make future contributions could have a well-funded pension plan).
Green: Well-Funded—Plan Sponsor Has High Capacity to Make Future Contributions
Starting with the top category shown in the graphic above, the green color reflects the benign nature of negative net cash flow for a plan with this status. For a defined benefit plan, the payment of benefits is fulfilling the purpose of the plan (providing benefits to retirees). A plan that is well funded often has obtained that position by making more disciplined contributions and is typically projected to have a high likelihood of being able cover future benefit payouts if the plan continues to be managed appropriately.
Contributions typically remain a requirement for well-funded plans and will likely be higher for those that remain open to new participants and future benefit accruals. The focus on the capacity for future contributions can become more critical in years where investment performance is negative and reduces funding status. This means a larger-than-normal contribution might be necessary in some years to normalize funding status as the result of investment losses, depending on a given plan’s funding policy.
Yellow: Underfunded —Plan Sponsor Has Medium Capacity to Make Contributions
The yellow category is the tipping point to the negative net cash flow indicator highlighting a material risk. For a mature plan with negative net cash flow, 60-80% funding status can cause some issues in the long-term for the plan if not managed appropriately. Benefit payments reduce the degree to which the investment return can help to close the funding gap, requiring the plan sponsor to make larger contributions over the long term to reach fully funded status.
Once again, the determining factor here is the capacity of the plan sponsor to make up the shortfall in both the present and the future. If the plan sponsor is able to increase contributions over time to increase funding status, the plan is able to move its negative net cash flow indicator upward toward the green scenario; however, if the plan sponsor is not able to increase contributions, the plan has the potential for its indicator to move downward toward the blue scenario.
Blue: Mature Plan, Less than 60% Funded — Plan Sponsor Unable to Immediately Make up Shortfall
The blue category is where negative net cash flow can be especially concerning. For a mature plan, below 60% funding again places a larger burden on investment returns and contributions to maintain solvency. The factor that makes this a material concern in the blue category is when the plan sponsor is unable to fund the shortfall. Prolonged exposure to such a situation has the potential for the liabilities to grow at a rate significantly greater than that of the assets, leading to lower funding status year over year.
In our opinion, capacity of the plan sponsor to make up the shortfall is the critical concern. Since required growth rate for assets to close the funding gap is extremely high, the only way to reliably increase the funding status over time is to increase contributions. Investment returns may not move the needle. Immediate changes to funding policy to increase contributions can help the plan to move upward toward at least yellow status over the short term, and, if viable over the long term, can help the plan to shift this indicator to green status.
Failure to correct this situation, whether by finding new funding sources or changing the plan benefits, can lead to insolvency for the plan. Ancillary consequences also include the potential for downgrades to the credit rating of the plan sponsor as we have seen examples of this in recent years. In our opinion, this category should precipitate immediate action by the plan sponsor by working with an investment provider, actuary, or some combination thereof. While there is no simple remedy to this situation, working with these providers to lay out all possible options may help avoid plan solvency issues in the long term.
What Levers Can a Plan Sponsor Pull to Move toward Green?
We mentioned previously that it would be irresponsible to suggest that there is a panacea approach applicable across the board to public defined benefit plans. With that said, there are different levers that have the potential to help improve plan health toward the green category. We have grouped these into three categories: funding policy, plan design and investment management policy. Consideration of the approaches described here should be discussed with the plan’s actuary, consultant and/or investment manager, as appropriate.
Funding Policy
The first funding policy lever centers on increasing both the amount of ongoing contributions and the capacity for making future contributions. We generally see two approaches to increasing contributions: taking additional funds from the operating budget, or implementing special taxes. Taking additional funds from the operating budget can be difficult—in a perfect world, this would be an easy solution; however, given most operating budgets are already strained, this might not work in isolation or without diverting funds from other equally worthy budget items. On the special taxes side, we have seen this in practice across the country, with most of the focus being on “sin” taxes. This might include an incremental sales tax on tobacco, alcohol or gambling, but there are also examples of property taxes, beverage taxes on sugary drinks and other sources being tapped to provide additional pension funding. The funds from these incremental taxes are typically contributed entirely as incremental contributions in excess of the normal planned annual contribution in a given year.
Plan Design
The second type of lever would be around plan design: reducing benefits or features for actives or retirees, closing or freezing the plan or moving to a different plan structure might be the only thing standing between the plan’s continuation and insolvency. Design changes have the effect of reducing the influx of new liabilities into the plan and in some cases reducing existing liabilities. This could potentially allow contributions and investment returns to have a greater impact on reducing the gap between assets and liabilities (thus, increasing funding status).
Investment Management Policy
The first investment policy lever centers on asset allocation as investment returns can help to increase funded status. For plans with a long time horizon, increasing allocations to equities and other growth assets can help to increase expected return and potential growth in the asset base. However, it is important to note that assets with higher return expectations tend to also have higher short-term volatility and some assets like private equities can increase illiquidity. Because of the volatility and illiquidity risks, making changes to asset allocation requires careful consideration and collaboration with the investment manager or consultant to determine if the plan sponsor is willing to accept those risks in light of the potential for increased returns.
The second investment policy lever centers on mitigating the cash flow effect on the portfolio for a plan with significant negative net cash flow. This lever would involve shifting the investment portfolio to more liquid asset classes, specifically short-term, cash-generating investments. The benefit to this is that the additional liquidity helps the portfolio to make cash distributions without having to generate liquidity at the cost of a discount to market value (for securities with less liquidity or that experience short-term volatility). The downside to this is that increasing liquid asset classes reduces the expected return, potentially requiring the plan sponsor to increase annual contributions to make up the shortfall.
Conclusion
Having laid out the different indications of negative net cash flow and the levers that can positively affect it, we would like to end on a final thought: it may be that a prudent generalized prescription to help plan sponsors looking to move toward green status is a combination of levers. As explained above, any single one of the levers above has the potential, if pulled too hard, to cause significant risks. By pulling multiple levers in tandem, each to a lesser degree than would be required if it was used on its own, a plan sponsor may be able to synergize the benefits while helping to minimize the potential drawbacks. It is important to have the plan’s actuary, consultant, and investment manager work in tandem to increase the likelihood of achieving and maintaining green status.
Accessible Version of Charts
| Fiscal Year | Percent |
| 2001 | -2.03219 |
| 2002 | -2.41151 |
| 2003 | -2.55626 |
| 2004 | -1.9961 |
| 2005 | -2.1742 |
| 2006 | -2.2333 |
| 2007 | -2.0865 |
| 2008 | -2.33566 |
| 2009 | -3.11785 |
| 2010 | -3.19264 |
| 2011 | -3.10346 |
| 2012 | -3.25298 |
| 2013 | -3.14727 |
| 2014 | -2.87453 |
| 2015 | -2.80907 |
| 2016 | -3.02335 |
| 2017 | -2.86441 |
| 2018 | -2.628 |
| 2019 | -2.57599 |
| 2020 | -2.47851 |
Chart 2: Number of Actives per Annuitant
| Fiscal Year | Public Plan Data | Census |
| 1992 | 2.533 | |
| 1993 | 2.6329 | |
| 1994 | 2.4751 | |
| 1995 | 2.5155 | |
| 1996 | 2.538 | |
| 1997 | 2.4689 | |
| 1998 | 2.4274 | |
| 1999 | 2.4487 | |
| 2000 | 2.2117 | |
| 2001 | 2.3888 | 2.3329 |
| 2002 | 2.3288 | 2.2821 |
| 2003 | 2.2204 | 2.2098 |
| 2004 | 2.1232 | 2.1154 |
| 2005 | 2.0574 | 1.8328 |
| 2006 | 2.009 | 1.99 |
| 2007 | 1.9635 | 1.9193 |
| 2008 | 1.9248 | 1.8937 |
| 2009 | 1.8622 | 1.8539 |
| 2010 | 1.771 | 1.7774 |
| 2011 | 1.6683 | 1.6872 |
| 2012 | 1.5865 | 1.595 |
| 2013 | 1.5206 | 1.5406 |
| 2014 | 1.4724 | 1.492 |
| 2015 | 1.4349 | 1.4759 |
| 2016 | 1.3955 | 1.4198 |
| 2017 | 1.3693 | 1.3521 |
| 2018 | 1.3393 | 1.3222 |
| 2019 | 1.3127 | 1.304 |
Chart 3: Cash Flow as a Percentage of Assets
| Fiscal Year | Percent |
| 2001 | -2.00318 |
| 2002 | -2.39381 |
| 2003 | -2.53613 |
| 2004 | -1.96516 |
| 2005 | -2.19288 |
| 2006 | -2.2322 |
| 2007 | -2.08736 |
| 2008 | -2.33111 |
| 2009 | -3.11717 |
| 2010 | -3.19384 |
| 2011 | -3.10064 |
| 2012 | -3.25234 |
| 2013 | -3.14725 |
| 2014 | -2.87379 |
| 2015 | -2.80853 |
| 2016 | -3.02058 |
| 2017 | -2.86488 |
| 2018 | -2.56792 |
| 2019 | -2.57599 |
| 2020 | -2.47851 |
Defining Negative Net Cash Flow Situations
| Green: Well-funded (80% or higher) & Plan sponsor has high capacity to make future contributions |
| Yellow: Underfunded (60-80%) & Plan sponsor has medium capacity to make future contributions |
| Blue: Severely underfunded (under 60%) & Plan sponsor has low capacity to make future contributions |