
Las universidades e institutos de educación superior enfrentan un panorama cambiante. Las expectativas de descuentos para matrículas, los nuevos modelos para la instrucción y el aprendizaje y las preguntas sobre el valor de un título universitario hacen que los profesionales de la educación superior se enfrenten hoy más que nunca a mayores obstáculos para preparar a los líderes del mañana. En PNC Institutional Asset Management®, nuestra solución de modelación financiera empresarial brinda herramientas a los líderes de la educación superior para mejorar la toma de decisiones y los resultados a largo plazo. La modelización financiera empresarial une la estrategia operativa, la salud financiera y la estrategia de inversión. Encontramos que los activos de inversión pueden tener un impacto considerable en las medidas de salud organizacional, incluidas las relacionadas con la liquidez y con las métricas específicas de la industria, como el índice financiero compuesto (CFI)1, y podrían tener un papel importante en la ejecución de proyectos de capital y el logro de su misión.
Cómo la modelación financiera empresarial busca mejorar la toma de decisiones
La modelación financiera empresarial guía a los clientes a través de un proceso de cuatro pasos que comienza con la adquisición de un profundo entendimiento de las metas de la institución y conduce a la implementación y el monitoreo de una estrategia de inversión personalizada.
1. Metas y proyecciones organizacionales
Nuestro flujo de trabajo de modelación comienza con un proceso de descubrimiento guiado por un cuestionario para comprender el papel que los activos de inversión juegan en la determinación de la salud financiera empresarial. Estas inversiones de grupos de activos incluyen fondos restringidos por los donantes y cuasidotaciones. También exploramos las métricas principales que determinan la salud financiera, las clases de activos permitidos y el gasto planificado a partir de los activos de inversión, entre otros temas relevantes para una estrategia de inversión optimizada.
Revisamos los planes estratégicos y las proyecciones financieras para mejorar nuestra comprensión sobre la salud financiera de la organización. Esta revisión anticipada, la cual puede incluir una discusión de los compromisos financieros planificados como se ilustra en la Figura 1, nos equipa con un panorama financiero que permita preparar una recomendación.
Figura 1: Ejemplo de cronograma de compromisos financieros
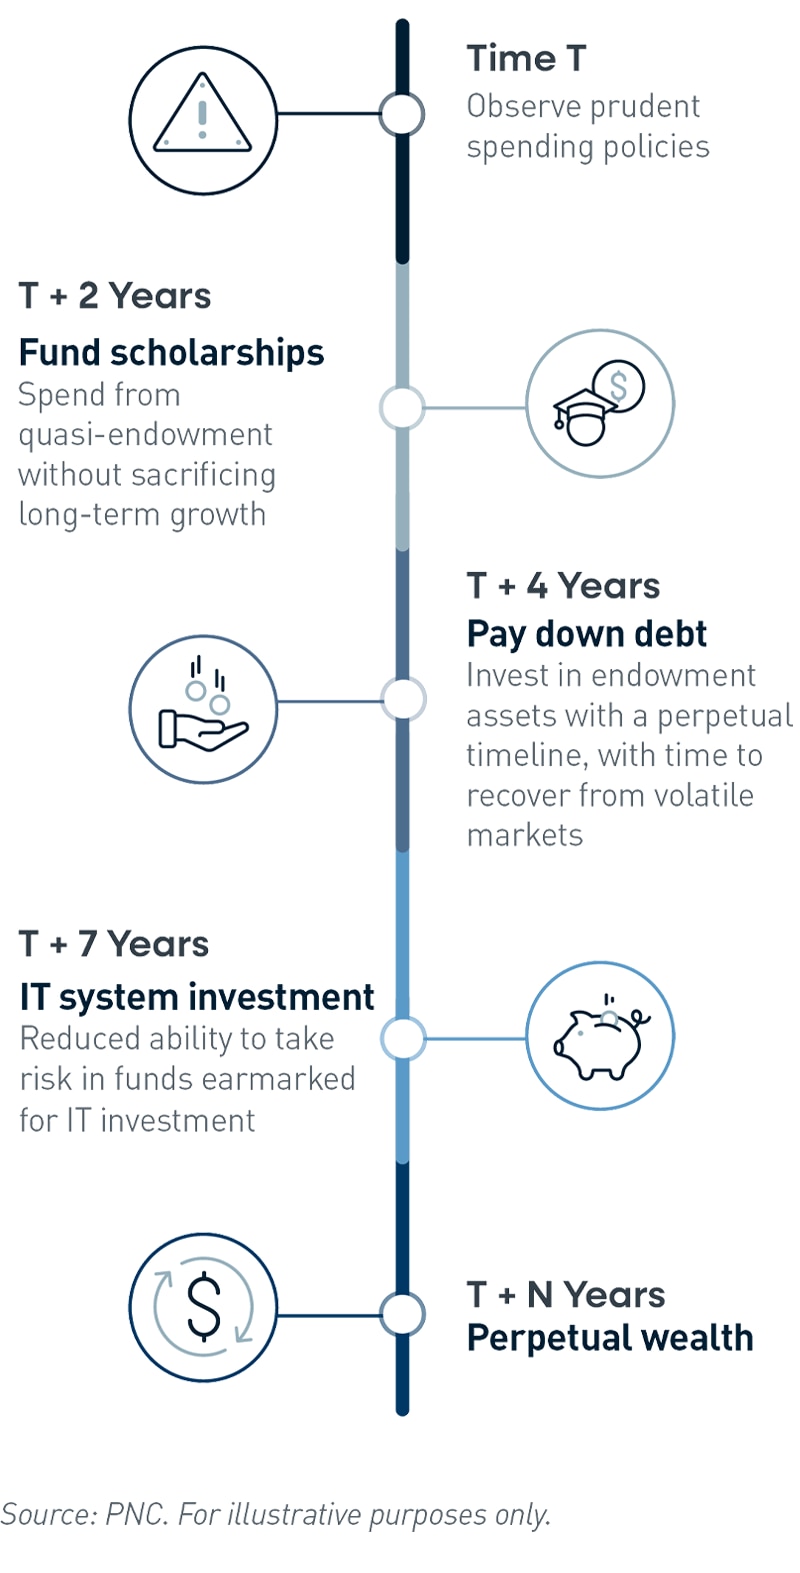
Ver la versión accesible de este gráfico.
2. Análisis financiero empresarial
El segundo paso une las inversiones con la salud financiera. Procuramos entender la influencia que la volatilidad del mercado y los diferentes perfiles de asignación de activos estratégicos tienen en el panorama financiero de la institución. En la práctica, esto significa examinar cómo los entornos favorables o desafiantes del mercado y las diferentes posturas ante el riesgo de inversión dentro de dichos entornos podrían afectar las métricas financieras vitales, como los días de efectivo disponible, la relación entre efectivo e inversiones frente a la deuda, o el puntaje compuesto del DOE.2
La Figura 2 ilustra el resultado de nuestro análisis de escenarios de una de esas métricas, el puntaje compuesto del DOE, entre diferentes perfiles potenciales de cartera. En este ejemplo, la magnitud del riesgo a la baja se expande a medida que el perfil de la cartera se vuelve más agresivo. Del mismo modo, también consideramos el impacto en la salud financiera del gasto de capital financiado con inversiones o con deuda. Estas perspectivas pueden preparar a los líderes de la educación superior para que tengan una mejor comprensión de la capacidad que su institución tiene para tolerar el riesgo de inversión y cuantificar el efecto financiero de la estrategia de inversión cambiante.
Figura 2: Ejemplo ilustrativo: Puntaje compuesto del DOE
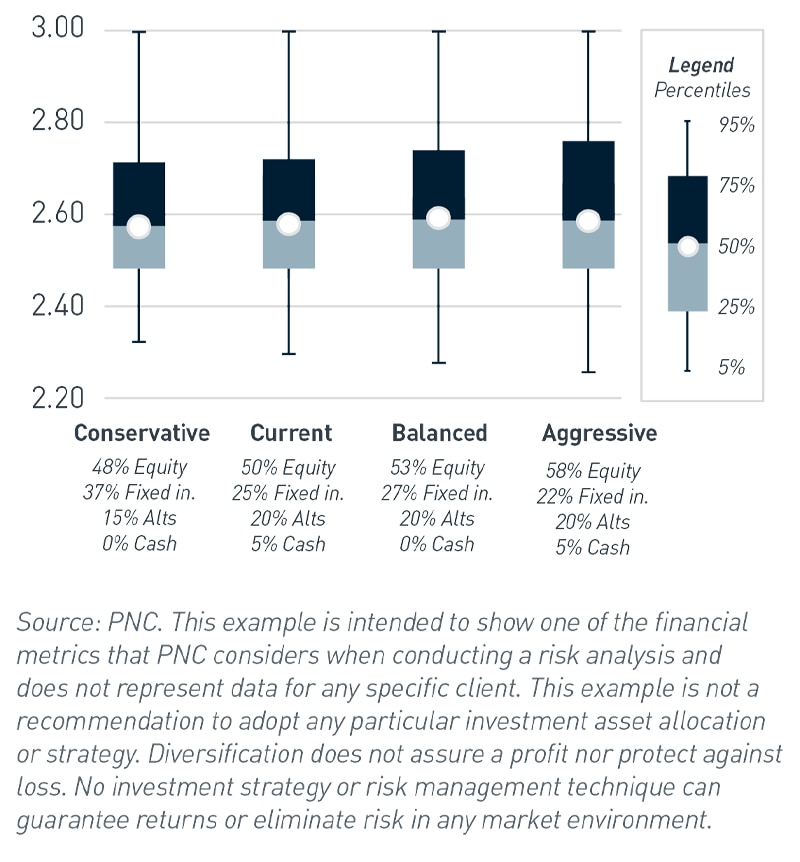
Ver la versión accesible de este gráfico.
3. Estrategia de inversión personalizada
Al contar con un conocimiento básico del cliente y una comprensión profunda de cómo la estrategia de inversión afecta la salud financiera general, personalizamos una recomendación en torno a cómo mejorar la probabilidad de lograr los resultados dirigidos de la métrica financiera (Figura 3). Por ejemplo, una institución puede querer evaluar en qué medida las inversiones pueden ayudar a brindar liquidez para un proyecto de gasto de capital, en lugar de utilizar el financiamiento de deuda. Otra organización tal vez desee lograr crecimiento de capital para fortalecer su relación entre efectivo e inversiones disponibles y la deuda. Sin importar cuál sea la meta, pretendemos lograr la asignación de activos óptima que equilibre de la manera más eficiente las necesidades de rendimiento con el presupuesto de riesgo correspondiente..
Figura 3: Resultados dirigidos de la métrica financiera
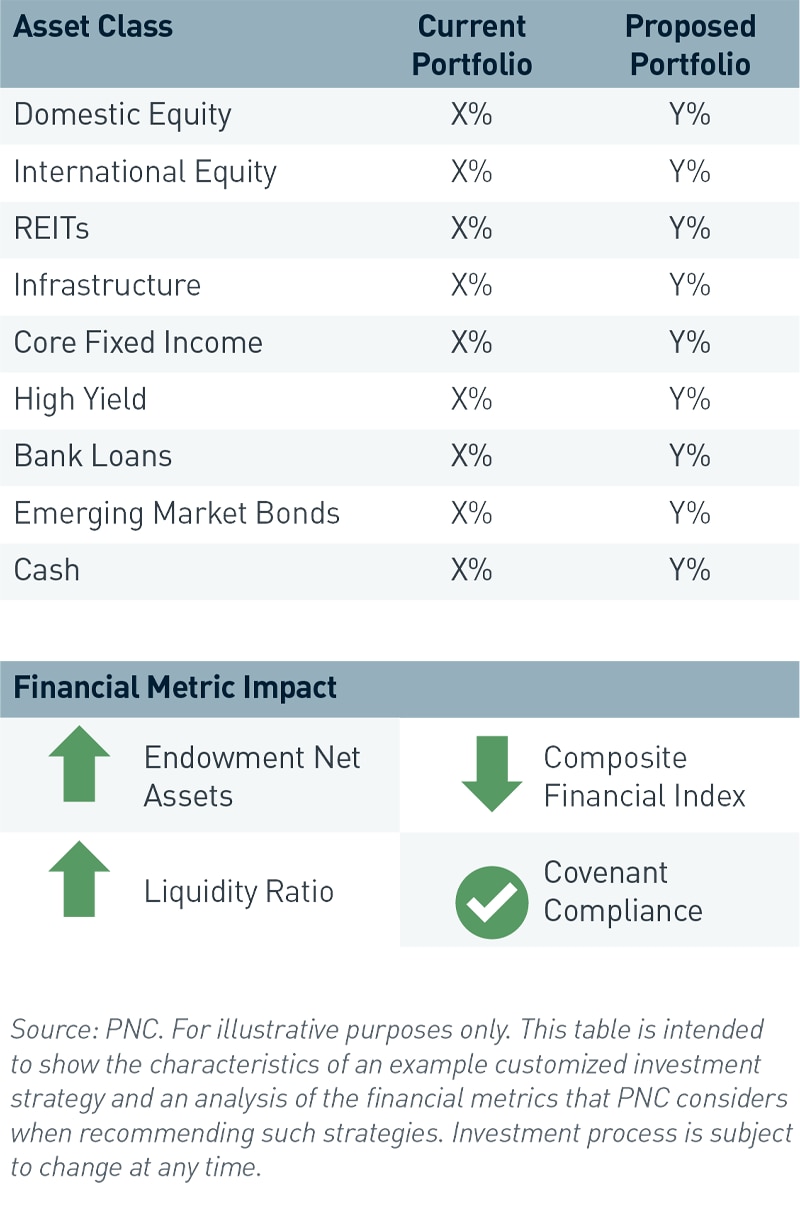
Ver la versión accesible de este gráfico.
4. Implementación y supervisión
Posteriormente implementamos la estrategia de inversión personalizada, que implica actualizar la declaración de política de inversión para reflejar con claridad las pautas definidas y los parámetros de riesgo concretos. El monitoreo constante, que normalmente se realiza mediante la elaboración de informes periódicos, es una verificación fundamental para ayudar a garantizar que la estrategia de inversión implementada siga siendo pertinente. Monitoreamos cómo las métricas financieras principales han cambiado con el tiempo (Figura 4). Estas medidas siguen siendo referencias para la salud de la organización y la volatilidad del mercado financiero influye en ellas. Ya sea que se produzca un cambio en las metas, el rendimiento operativo u otro factor sustancial, mantenemos una conversación continua con nuestros clientes para asegurarnos de que la estrategia de inversión siga encaminada.
Figura 4: Días de efectivo disponible
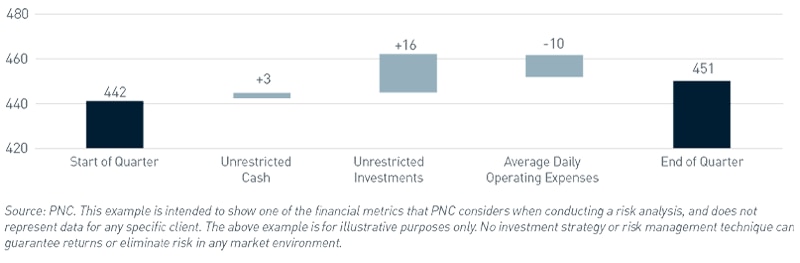
Ver la versión accesible de este gráfico.
Al reconocer la intersección entre las reservas de inversiones y la salud financiera, los inversionistas institucionales pueden tomar decisiones más informadas y mejorar los resultados. Para obtener más información sobre cómo PNC ha ayudado a las organizaciones como la suya, por favor, póngase en contacto con su representante de PNC.
1 - El CFI es una medida de salud financiera que se utiliza ampliamente en todo el sector de educación superior. Consta de cuatro índices básicos que miden diferentes aspectos del bienestar financiero: reserva primaria, viabilidad, retorno sobre los activos netos e ingresos operativos netos.
2 - El puntaje compuesto del DOE es un indicador general de la capacidad que una institución tiene para demostrar que mantiene los estándares de responsabilidad financiera necesarios para participar en los programas pertenecientes al Título IV (ayuda federal para estudiantes).
Versión accesible de los gráficos
Figura 1: Ejemplo de cronograma de compromisos financieros
|
Ejemplo de cronograma de compromisos financieros |
Tiempo T |
Observe las políticas de gasto prudente |
T + 2 años |
Otorgar financiamiento para becas Gaste de las cuasidotaciones sin sacrificar el crecimiento a largo plazo |
T + 4 años |
Liquidar las deudas Realice inversiones en activos de dotaciones con tiempo para recuperarse de los mercados volátiles |
T + 7 años |
Inversión en sistemas de TI Reducción de la capacidad para asumir riesgos en los fondos destinados a TI |
T + de N años |
Patrimonio perpetuo |
Figura 2: Puntaje compuesto del DOE
|
Conservador |
Actual |
Equilibrado |
Agresivo |
0-5 |
2.28 |
2.29 |
2.26 |
2.24 |
5-25 |
0.19 |
0.18 |
0.21 |
0.22 |
25-50 |
0.12 |
0.11 |
0.12 |
0.13 |
50-75 |
0.13 |
0.14 |
0.14 |
0.16 |
75-95 |
0.28 |
0.28 |
0.27 |
0.25 |
Mediana |
2.58 |
2.58 |
2.59 |
2.59 |
Figura 3: Resultados objetivo de la métrica financiera
Clase de activos |
Cartera actual |
Cartera propuesta |
Acciones nacionales |
X % |
Y % |
Acciones internacionales |
X % |
Y % |
REIT |
X % |
Y % |
Infraestructura |
X % |
Y % |
Renta fija básica |
X % |
Y % |
Alto rendimiento |
X % |
Y % |
Préstamos bancarios |
X % |
Y % |
Bonos de mercados emergentes |
X % |
Y % |
Dinero en efectivo |
X % |
Y % |
Figura 4: Días de efectivo disponible
seguro social |
Otoño |
Incremento |
|
Inicio del trimestre |
|
- |
442.39 |
Dinero en efectivo sin restricciones |
442.39 |
- |
2.96 |
Inversiones sin restricciones |
445.35 |
- |
16.11 |
Promedio Gastos operativos diarios |
451.09 |
10.38 |
- |
Fin del trimestre |
451.09 |