
In recent years, equity market performance has become increasingly influenced by the artificial intelligence (AI) theme and a small number of mega-capitalization (cap) technology companies. The 10 largest companies in the S&P 500® currently represent approximately 39% of the index, a level not seen since the 1960s. Likewise, the MSCI ACWI IMI has become increasingly weighted towards U.S. equities. The United States currently comprises 62.5% of the index and the Information Technology and Communication Services sectors combined account for nearly 37%.
AI’s growing influence may leave traditional portfolios less diversified than they appear. Alternatives can offer differentiated sources of return and may help reduce concentration risk.
While historically, equities have served as the primary driver of long-term portfolio growth, today's equity allocation is more concentrated than many investors realize. The adoption of AI has been remarkable. In the less than four years since OpenAI launched ChatGPT in November 2022, AI has evolved from an emerging technology to a dominant equity market theme. Looking beyond the Magnificent 7 (Alphabet Inc., Amazon.com, Inc., Apple Inc., Meta Platforms, Inc., Microsoft Corp., Nvidia Corp. and Tesla, Inc.), many companies have now become reliant on AI-related investment and spending to support future earnings growth. Additionally, the rise of passive investing may amplify concentration as capital is allocated based on market capitalization rather than fundamentals. As companies become larger, they receive a greater share of index flows, creating a feedback loop that can further increase benchmark concentration and investor exposure to a narrow set of companies.
This concentration has not been limited to equities; fixed income markets have also begun to reflect AI-driven growth. Corporate and securitized bonds are increasingly being leveraged to fund data center construction, power infrastructure and other investments to support AI. According to analysis done by Apollo, on a year-to-date basis, about half the net issuance in investment grade bonds and 38% of the high yield bond market is now related to AI[1] . Looking ahead, as hyperscalers and technology companies continue to invest heavily across the companies and infrastructure supporting AI deployment, portions of the fixed income market may become more exposed to the same underlying AI theme. AI financing may also occur through project finance structures, private credit and other specialized capital solutions used to fund AI-related infrastructure development.
A traditional global 60/40 (60% allocation to equities, 40% allocation to fixed income) portfolio may have greater exposure to AI and technology-related themes than many investors intend. At PNC, we believe diversification extends beyond allocating to equities and fixed income — it means diversifying across sectors, investment styles and return drivers. As public markets become more concentrated, alternative investments can provide access to differentiated sources of return while offering potential benefits such as diversification, downside protection and absolute return potential. That said, not all alternative investments reduce AI exposure. Thoughtful manager selection and careful portfolio construction remain critical, as certain private market strategies may have equal or greater exposure to AI-related themes than public markets.
AI exposure across traditional benchmarks
Looking beneath headline asset allocations can reveal how concentrated many portfolios have become. We believe it is important for investors to understand the underlying exposures embedded within their portfolios, rather than relying solely on asset class labels.
A traditional global 60/40 portfolio (60% MSCI ACWI IMI, 40% Bloomberg U.S. Aggregate benchmark) currently has about 24% direct exposure to Information Technology and Communication Services and approximately 30% broader exposure to AI-related businesses* (Figure 1). Alternatives can help diversify portfolios from market-cap-weighted exposures through different investment approaches and sources of return that may complement traditional stocks and bonds.
Figure 1. Index Sector Exposures
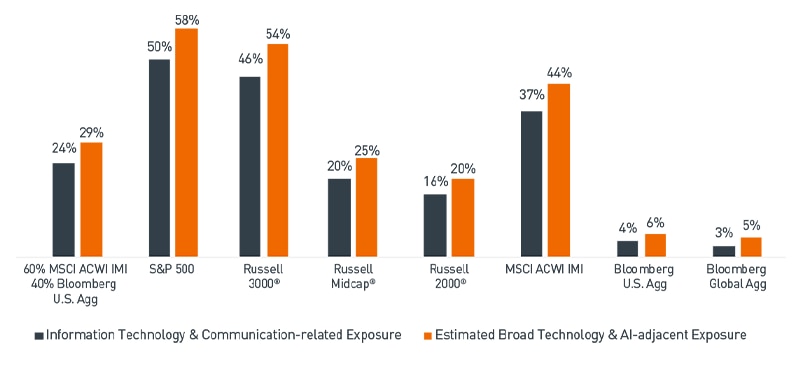
*Info Tech. & Comm.-Related Exposure is the combined weight of the GICS Information Technology and Communication Services sectors in each equity benchmark. Est. Broad Tech. & AI-Adjacent Exposure adds the weight of companies outside those sectors that are materially linked to AI infrastructure or adoption, identified by GICS sub-industry (such as data centers, communication towers, electrical equipment and power generation) and a defined list of additional companies. Bond index figures are estimates based on issuer sector data, and the 60/40 portfolio is calculated from its component weights.
As of 10/26/2026. Source: Morningstar
View accessible version of this chart.
Alternatives can help diversify AI concentration
As market concentration has increased, this dynamic has created portfolios with greater sensitivity to hyperscaler capital spending, interest rate movements, valuations and investor sentiment toward AI. When market concentration is high, diversification weakens as asset correlations rise. The table below highlights how various alternative investment strategies have historically exhibited lower correlations to a globally diversified 60/40 portfolio (Figure 2).
Figure 2. Asset Class Correlations to Global 60/40 Portfolio* (Trailing 3-year)
Most alternative sub-asset classes have lower correlations to the 60/40 portfolio than the S&P 500 and MSCI ACWI IMI
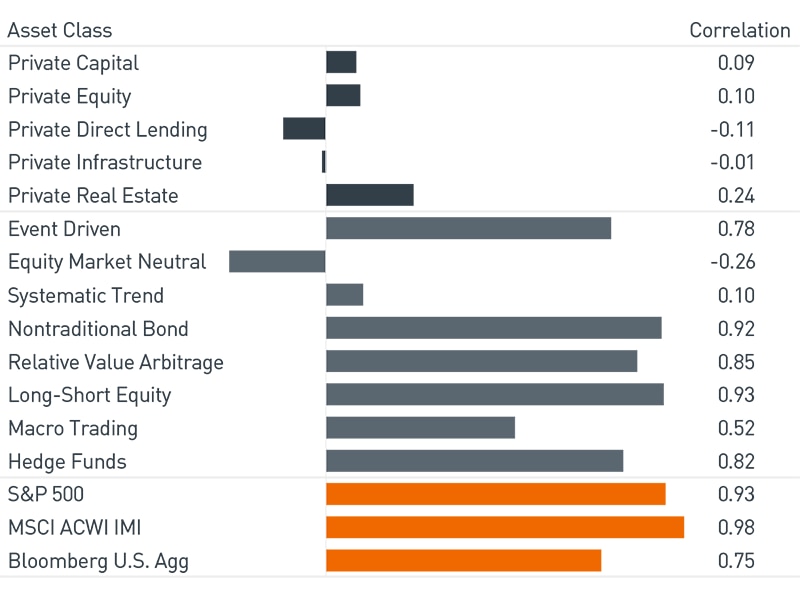
*60% MSCI ACWI IMI, 40% Bloomberg U.S. Aggregate
As of 7/1/2023-6/30/2026. Source: Morningstar
View accessible version of this chart.
Certain alternative strategies may help reduce a portfolio’s overall dependency on AI-related market movements. Alternative investments are not a uniform asset class, and diversification benefits can vary greatly.
- Private equity seeks to drive long-term capital appreciation through operational or strategic improvements aiming to sell private businesses at premium valuations.
- Private credit seeks to provide income through direct lending to private companies with returns primarily driven by interest payments, credit spreads, lender protections and floating rate loans.
- Private infrastructure and real estate seek to provide income, inflation protection and long-term growth through ownership of essential assets with returns from contracted cash flows and demand for critical services.
- Hedge funds and liquid alternatives seek to diversify portfolios through flexible mandates that can react opportunistically to macro conditions and help mitigate downside risks.
While alternative strategies may certainly have exposure to technology and AI-related businesses, private market, hedge funds and liquid alternatives can draw returns from distinct sources and therefore serve different portfolio objectives. Relative value and event-driven strategies seek returns from arbitrage, corporate events and security selection, rather than broad market direction. Global macro and managed futures strategies capitalize on price movements across equities, interest rates, currencies and commodities. Although these strategies remain sensitive to market conditions, their returns have historically depended less on corporate earnings growth and market-cap-weighted benchmarks, making them potential diversifiers as traditional markets become more concentrated. These types of alternative strategies are driven by investment processes that can differ from those associated with a long-only equity portfolio or long-only 60/40 portfolio.
The risk-adjusted performance case for alternatives
While many investors evaluate alternative investments for inclusion in portfolios primarily for their diversification benefits, many alternative strategies have also historically delivered attractive risk-adjusted returns. As shown below, several alternative strategies have exhibited lower correlations to global equity markets and maintained competitive risk-adjusted returns as measured by their Sharpe ratios (Figure 3). Traditional public market benchmarks, including the S&P 500, MSCI ACWI IMI and a global 60/40 portfolio have historically exhibited high correlations to one another, while many alternative strategies have historically exhibited lower correlations, a reduced dependence on market direction and attractive risk-adjusted returns.
Figure 3. Risk-adjusted Returns vs. Global 60/40 Portfolio* Correlation (Trailing 10-year)
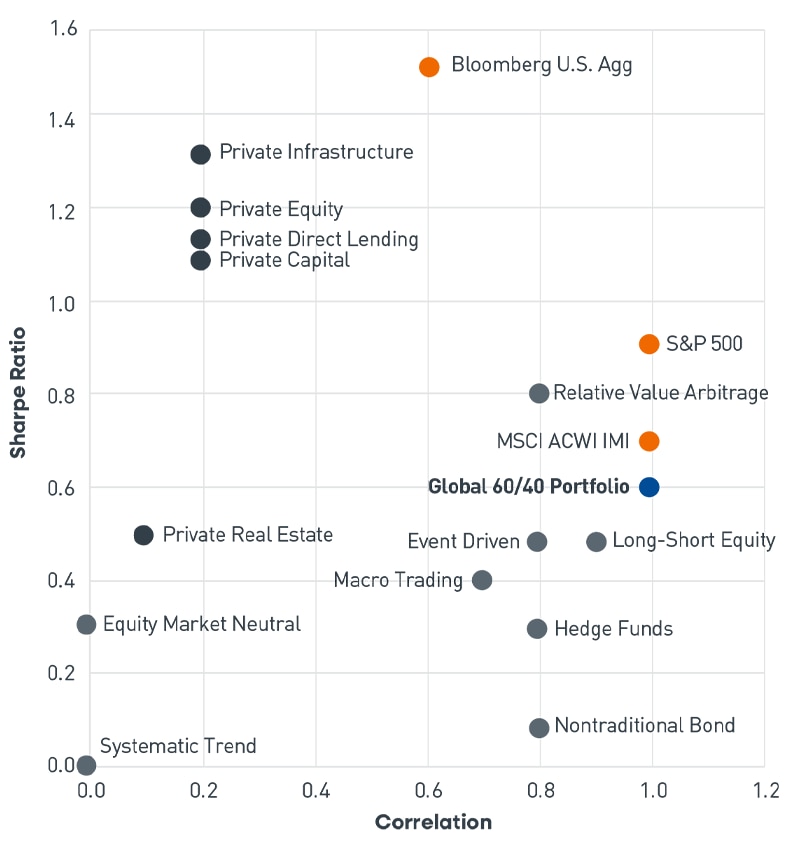
* 60% MSCI ACWI IMI, 40% Bloomberg U.S. Aggregate
As of 7/1/2016-6/30/2026. Source: Morningstar
View accessible version of this chart.
Key takeaways
In our view, the illusion of adequate portfolio diversification is an important risk facing investors today. Market-cap-weighted benchmarks have become increasingly dominated by mega-cap technology and AI-related companies, which has left portfolios more dependent on this single market driver. While traditional stock and bond allocations can still provide diversification benefits, they may be more sensitive to hyperscaler capital expenditures, interest rates and valuations than in previous market cycles.
We encourage investors to think beyond simply allocating between equities and fixed income and consider introducing different return drivers, as appropriate. Alternative investments such as private equity, private credit, private real assets, liquid alternatives and hedge funds can provide exposure to differentiated sources of risk and return that are less dependent on market-cap-weighted benchmarks and AI-powered corporate earnings growth. Expanding an investor’s opportunity set through alternative assets can help build more durable portfolios and reduce reliance on any single theme, sector, company or source of return.
TEXT VERSION OF CHART
Figure 1. Index Sector Exposures (view image)
Benchmark Index | Info Tech. & Comm.-Related Exposure | Est. Broad Tech. & AI-Adjacent Exposure |
60% MSCI ACWI IMI, 40% Bloomberg U.S. Agg | 24% | 29% |
S&P 500 | 50% | 58% |
Russell 3000® | 46% | 54% |
Russell Midcap® | 20% | 25% |
Russell 2000® | 16% | 20% |
MSCI ACWI IMI | 37% | 44% |
Bloomberg U.S. Agg | 4% | 6% |
Bloomberg Global Agg | 3% | 5% |
*Info Tech. & Comm.-Related Exposure is the combined weight of the GICS Information Technology and Communication Services sectors in each equity benchmark. Est. Broad Tech. & AI-Adjacent Exposure adds the weight of companies outside those sectors that are materially linked to AI infrastructure or adoption, identified by GICS sub-industry (such as data centers, communication towers, electrical equipment and power generation) and a defined list of additional companies. Bond index figures are estimates based on issuer sector data, and the 60/40 portfolio is calculated from its component weights.
As of 10/26/2026. Source: Morningstar
Figure 2. Asset Class Correlations to Global 60/40 Portfolio* (Trailing 3-year) (view image)
Most alternative sub-asset classes have lower correlations to the 60/40 portfolio than the S&P 500 and MSCI ACWI IMI
Trailing 3-years | Correlation to Global 60%/40% AGG |
Private Capital | 0.09 |
Private Equity | 0.10 |
Private Direct Lending | -0.11 |
Private Infrastructure | -0.01 |
Private Real Estate | 0.24 |
Event Driven | 0.78 |
Equity Market Neutral | -0.26 |
Systematic Trend | 0.10 |
Nontraditional Bond | 0.92 |
Relative Value Arbitrage | 0.85 |
Long-Short Equity | 0.93 |
Macro Trading | 0.52 |
Hedge Funds | 0.82 |
S&P 500 | 0.93 |
MSCI ACWI IMI | 0.98 |
Bloomberg U.S. Agg | 0.75 |
*60% MSCI ACWI IMI, 40% Bloomberg U.S. Aggregate
As of 7/1/2023-6/30/2026. Source: Morningstar
Figure 3. Risk-adjusted Returns vs. Global 60/40 Portfolio* Correlation (Trailing 10-year) (view image)
The biggest widening in credit spreads has occurred in the lowest-rated tier of corporate high yield bonds
Trailing 10 Years | Correlation to Global 60/40 | Sharpe Ratio |
Private Capital | 0.2 | 1.1 |
Private Equity | 0.2 | 1.14 |
Private Direct Lending | 0.2 | 1.2 |
Private Infrastructure | 0.2 | 1.3 |
Private Real Estate | 0.1 | 0.5 |
Event Driven | 0.8 | 0.5 |
Equity Market Neutral | 0.0 | 0.3 |
Systematic Trend | 0.0 | 0.0 |
Nontraditional Bond | 0.8 | 0.1 |
Relative Value Arbitrage | 0.8 | 0.8 |
Long-Short Equity | 0.9 | 0.5 |
Macro Trading | 0.7 | 0.4 |
Hedge Funds | 0.8 | 0.3 |
S&P 500 | 1.0 | 0.9 |
MSCI ACWI IMI | 1.0 | 0.7 |
Bloomberg U.S. Agg | 0.6 | 1.5 |
Global Balanced Portfolio | 1.0 | 0.6 |
* 60% MSCI ACWI IMI, 40% Bloomberg U.S. Aggregate
As of 7/1/2016-6/30/2026. Source: Morningstar