

Market review: Return of the AI
A ceasefire in the Iran conflict cleared the way for a global equity rebound in April as investors refocused on market fundamentals. The S&P 500® and Nasdaq indices rallied to their best monthly returns since 2020 (Figure 1), bolstered by strong earnings results and capital expenditure (capex) increases from large artificial intelligence (AI)-related technology companies.
Figure 1. Monthly Returns for the S&P 500 Over the Last Five Years
The S&P 500 rebounded to its strongest monthly return in five years in April
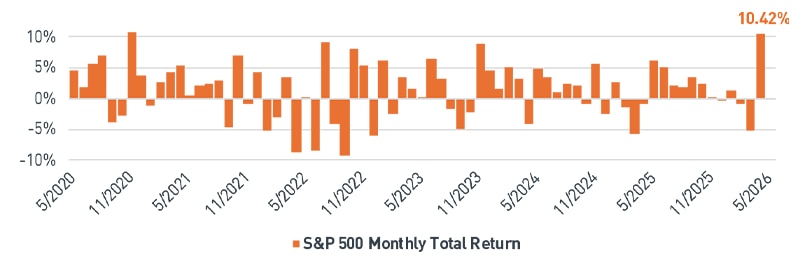
As of 4/30/2026. Source: Bloomberg L.P.
View accessible version of this chart.
Headlines surrounding the stalemate in the Middle East caused swings in energy markets and West Texas Intermediate (WTI) crude oil prices ended the month modestly higher. Inflation risks continued to weigh on the bond market, with the 10-year U.S. Treasury yield rising alongside oil prices (Figure 2). At its April 29 meeting, the Federal Reserve left interest rates unchanged amid ongoing uncertainty about the economy and inflation.
Figure 2. Year-to-date WTI Crude Oil Price and 10-year U.S. Treasury Yield Movements
Oil prices and bond yields became increasingly correlated following the breakout of the conflict in Iran
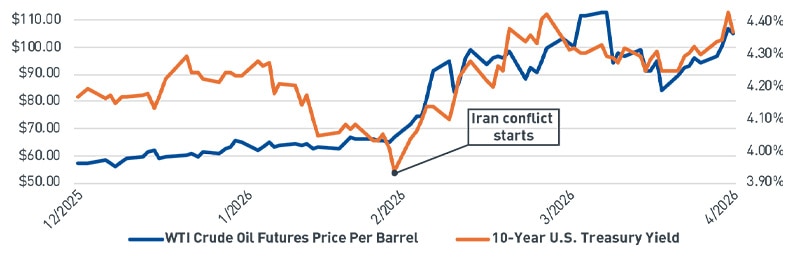
As of 4/30/2026. Source: Bloomberg L.P.
View accessible version of this chart.
Short takes
The standoff
- Both the U.S. and Iran seem to believe that the other will face greater pressure in the coming weeks and months following the Strait of Hormuz closure.
- Negotiating positions remain far apart, but pressure is building on both sides.
The China question
- China prefers stability in the Middle East, and the upcoming in-person meeting between Presidents Trump and Xi could be a positive catalyst for China technology stocks.
Wealth effect de-risking
- The stock market rebound means the “wealth effect” is no longer in danger of going in reverse, a positive development for the stability of consumer spending amid rising prices.
The big picture: Business spending is back in the driver’s seat
While the stalemate in the Middle East continues to generate headlines, the stock market has focused on accelerating earnings and business investment. First-quarter earnings season has thus far brought the strongest earnings growth and positive earnings revisions for the S&P 500 in years. While these earnings trends are broadening, technology remains the key driver. Earnings releases among mega-capitalization hyperscalers revealed increasing capex guidance for 2026 – pushing their estimated spending this year to more than $700 billion. Analysts expect this trend to continue, with even higher capex estimates for 2027 due to continued demand for AI semiconductor chips, servers, data centers and related infrastructure.
Current business investment momentum is being aided by last year’s budget package, which allows for the full expensing of capex and research and development in the current year. Recent economic data reinforces this trend of robust business investment, with durable goods orders (excluding defense and aircraft) hitting the highest level in five years, attributed to significant computer and electronics demand (Figure 3). Recent data points in the AI-fueled capex and business investment cycle have not only held up during the Middle East conflict, but some have even accelerated.
Figure 3. Monthly Change in Durable Goods Orders (Non-Defense Ex-Aircraft) Over the Last Five Years
Durable good orders (non-defense ex-aircraft) posted their largest monthly gain in over five years in March
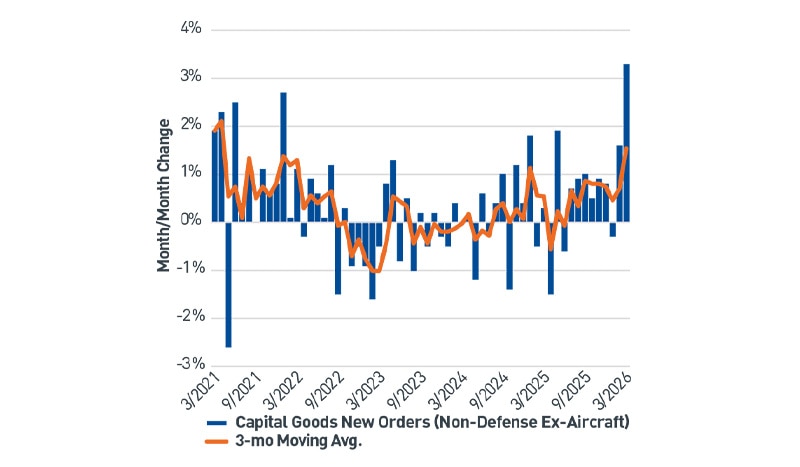
As of 4/30/2026. Source: Bloomberg L.P.
View accessible version of this chart.
Business investment is also supporting broader economic growth. First-quarter U.S. gross domestic product (GDP) was reported at a solid 2%, but the decomposition reveals that business investment had the largest increase, and its nonresidential component was the largest contributor. Nonresidential fixed investment grew at a 10.4% annualized rate – the highest in three years – boosted by technology hardware and software investment from the AI infrastructure buildout. Personal consumption is the largest component of GDP and has historically been relatively stable, while fixed investment is more variable – making it a potential swing factor to growth at a time when macroeconomic uncertainty remains elevated. We expect these trends to continue throughout 2026 and into 2027.
Outlook and portfolio positioning
Market consensus is coalescing around our long-held view that the economy is in the midst of a robust business investment and AI-driven productivity cycle. While higher gasoline and diesel prices could lead to cost pressures and plateau consumer spending, the boom led by AI infrastructure capex will not be easily derailed, in our view.
We believe this trend will continue to underpin equity markets for some time, and combined with strong earnings, supports our tactical tilt towards equities with an emphasis on AI-related technology companies in the U.S. and emerging markets.
Figure 1. Monthly Returns for the S&P 500 Over the Last Five Years (view image)
The S&P 500 rebounded to its strongest monthly return in five years in April
Date |
S&P 500 Monthly Total Return |
5/2020 |
4.53% |
11/2020 |
10.75% |
5/2021 |
0.55% |
11/2021 |
-0.83% |
5/2022 |
0.01% |
11/2022 |
5.38% |
5/2023 |
0.25% |
11/2023 |
8.92% |
5/2024 |
4.80% |
11/2024 |
5.73% |
5/2025 |
6.15% |
11/2025 |
0.13% |
5/2026 |
10.42% |
As of 4/30/2026. Source: Bloomberg L.P.
Figure 2. Year-to-date WTI Crude Oil Price and 10-year U.S. Treasury Yield Movements (view image)
Oil prices and bond yields became increasingly correlated following the breakout of the conflict in Iran
Date |
10-Year U.S. Treasury Yield |
WTI Crude Oil Futures Price Per Barrel |
12/2025 |
4.17% |
$57.42 |
1/2026 |
4.24% |
$65.21 |
2/2026 |
3.94% |
$67.02 |
3/2026 |
4.32% |
$101.38 |
4/2026 |
4.37% |
$105.07 |
As of 4/30/2026. Source: Bloomberg L.P.
Figure 3. Monthly Change in Durable Goods Orders (Non-Defense Ex-Aircraft) Over the Last Five Years (view image)
Durable good orders (non-defense ex-aircraft) posted their largest monthly gain in over five years in March
Capital Goods New Orders (Non-Defense Ex-Aircraft) |
3-mo Moving Average |
|
3/2021 |
1.9% |
1.9% |
9/2021 |
0.0% |
0.5% |
3/2022 |
1.1% |
1.3% |
9/2022 |
-1.5% |
-0.1% |
3/2023 |
-0.5% |
-1.0% |
9/2023 |
0.2% |
-0.1% |
3/2024 |
0.0% |
0.0% |
9/2024 |
1.0% |
0.4% |
3/2025 |
0.3% |
0.5% |
9/2025 |
1.0% |
0.9% |
3/2026 |
3.3% |
1.5% |
As of 4/30/2026. Source: Bloomberg L.P.