
Market review: Stocks return from vacation
Global equities rebounded in August, led by domestic and emerging market indices with exposure to large-capitalization Technology stocks. Second-quarter earnings season delivered a 50% growth rate for the S&P 500®, the strongest quarterly growth since 2021. Despite a lack of resolution to the U.S.-Iran conflict, tensions were subdued throughout most of the month, until military strikes re-escalated in the final week.
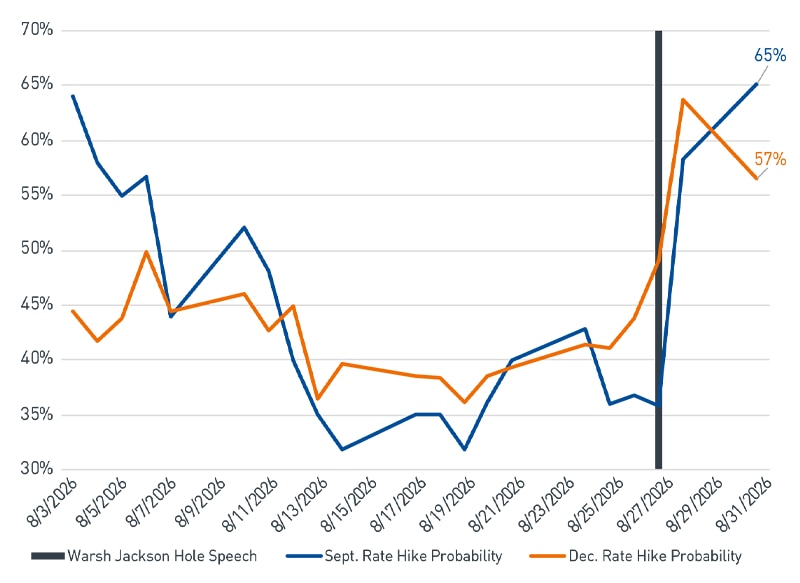
Against this backdrop, crude oil prices and global bond yields rose. Following Federal Reserve (Fed) Chair Warsh’s hawkish speech at Jackson Hole, market expectations for policy rate hikes this year increased (Figure 1) and the 10-year U.S. Treasury (UST) yield reached its highest level since January 2025. Additionally, gold delivered its best monthly return since January, driven by the Treasury’s planned increase of long-term bond buybacks and intervention in the Japanese yen.
Figure 1. Market-implied Probability of Fed Rate Hikes Throughout August 2026
Market expectations for rate hikes at the upcoming Fed meetings spiked following Chair Warsh’s hawkish Jackson Hole speech
As of 8/31/2026. Source: Bloomberg L.P.
View accessible version of this chart.
Short takes: Fixed income and the UST
- Several forces are converging: a $2 trillion fiscal deficit, the White House’s request for a 50% increase in the defense budget, $4 trillion in U.S. corporate debt issuance in 2025 and 2026, rising global debt levels, midterm elections and higher oil and diesel prices.
- The Treasury has a lot of ammunition to temper the rise of long-term interest rates, but the path of least resistance for the 10-year UST still looks to be higher, albeit bumpy.
- The continuation of this trend would likely pose a headwind for long-duration fixed income.
The big picture: Bonds under pressure
Global bond yields and crude oil prices have both risen since the U.S.–Iran conflict began at the end of February. Crude oil prices have been volatile but remain below peak conflict levels, while bond yields have continued to march higher.
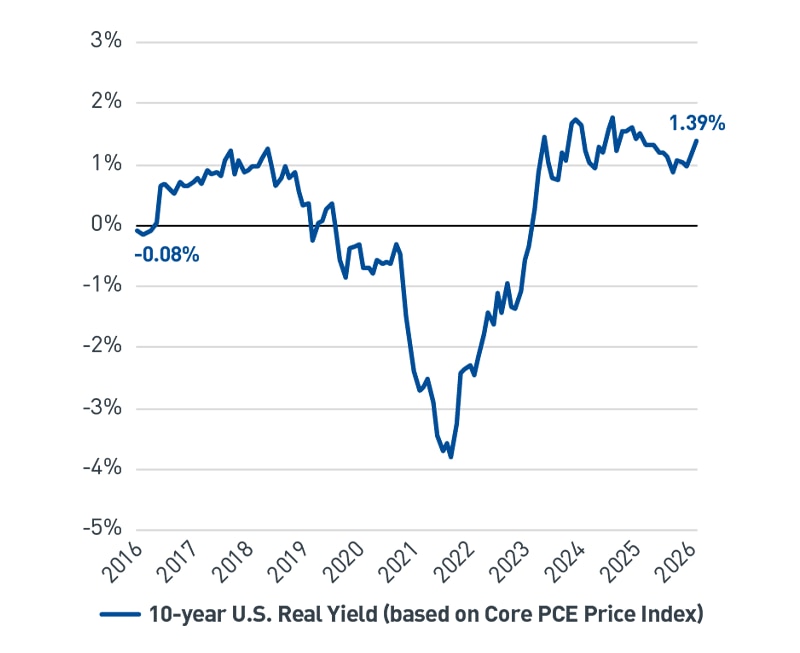
We believe the recent divergence suggests that markets have moved beyond the view that inflation, caused by rising energy prices, is the primary driver of rising interest rates. Real yields, which strip out the effect of inflation, have also been rising – which suggests that inflation concerns are no longer the sole reason for rising interest rates (Figure 2).
Figure 2. 10-year Real Yields (U.S. 10-year Treasury - Core PCE)
Longer-term real yields have risen sharply this year as non-inflationary factors helped push yields higher
As of 7/31/2026. Source: Bloomberg L.P.
View accessible version of this chart.
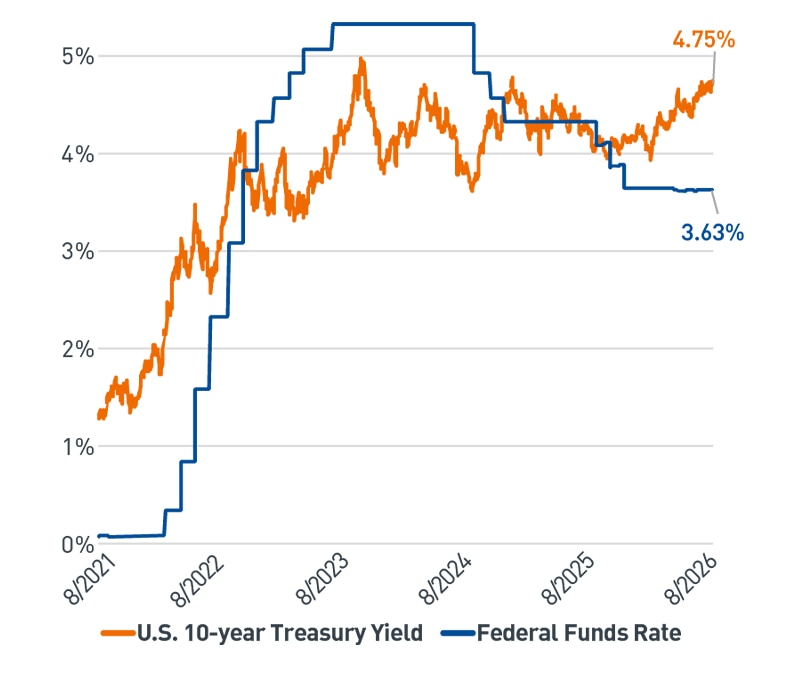
The latest instance of a separation in short- and long-term U.S. interest rates occurred in September 2024, paradoxically, when the Fed began its most recent rate-cutting cycle. While the 10-year UST yield and fed funds rate are often relatively correlated, a sharp move higher in the 10-year yield coincided with the Fed’s initial rate cut. This year, while the Fed has been on pause, the divergence has widened and notably since the beginning of the Iran conflict (Figure 3).
Figure 3. U.S. 10-year Treasury Yield vs. the Fed Funds Rate
Longer-term bond yields have diverged from the fed funds rate this year, with the 10-year UST rising as the Fed stays on hold
As of 8/31/2026. Source: Bloomberg L.P.
View accessible version of this chart.
Outlook and portfolio positioning
We believe elevated long-term interest rates remain a key risk, as the market is unlikely to easily digest further increases in bond yields. However, we believe a big move higher from current levels would still be required for equities to reprice.
Therefore, we remain constructive on equities as the market’s underlying fundamentals continue to show resilience. Looking ahead, we expect volatility to increase in the coming months due to elevated long-term interest rates, uncertainty on Fed policy and the upcoming midterm elections.
Figure 1. Market-implied Probability of Fed Rate Hikes Throughout August 2026 (view image)
Market expectations for rate hikes at the upcoming Fed meetings spiked following Chair Warsh’s hawkish Jackson Hole speech
Date | Sep Rate Hike Probability | Dec Rate Hike Probability | Warsh Jackson Hole Speech |
8/3/26 | 64% | 45% | 0 |
8/5/26 | 55% | 44% | 0 |
8/7/26 | 44% | 45% | 0 |
8/11/26 | 48% | 43% | 0 |
8/13/26 | 35% | 36% | 0 |
8/17/26 | 35% | 39% | 0 |
8/19/26 | 32% | 36% | 0 |
8/21/26 | 40% | 39% | 0 |
8/25/26 | 36% | 41% | 0 |
8/27/26 | 36% | 49% | 1 |
8/31/26 | 65% | 57% | 0 |
As of 8/31/2026. Source: Bloomberg L.P.
Figure 2. 10-year Real Yields (U.S. 10-year Treasury - Core PCE) (view image)
Longer-term real yields have risen sharply this year as non-inflationary factors helped push yields higher
Date | 10-year U.S. Real Yield (based on Core PCE Price Index) |
2026 | 1.39% |
2025 | 1.51% |
2024 | 1.22% |
2023 | -0.34% |
2022 | -2.46% |
2021 | -2.70% |
2020 | -0.69% |
2019 | 0.38% |
2018 | 0.96% |
2017 | 0.79% |
2016 | -0.15% |
As of 7/31/2026. Source: Bloomberg L.P.
Figure 3. U.S. 10-year Treasury Yield vs. the Fed Funds Rate (view image)
Longer-term bond yields have diverged from the fed funds rate this year, with the 10-year UST rising as the Fed stays on hold
Date | U.S. 10-year Treasury Yield | Federal Funds Rate |
8/2026 | 4.75% | 3.63% |
8/2025 | 4.23% | 4.33% |
8/2024 | 3.90% | 5.33% |
8/2023 | 4.11% | 5.33% |
8/2022 | 3.19% | 2.33% |
8/2021 | 1.31% | 0.06% |
As of 8/31/2026. Source: Bloomberg L.P.