
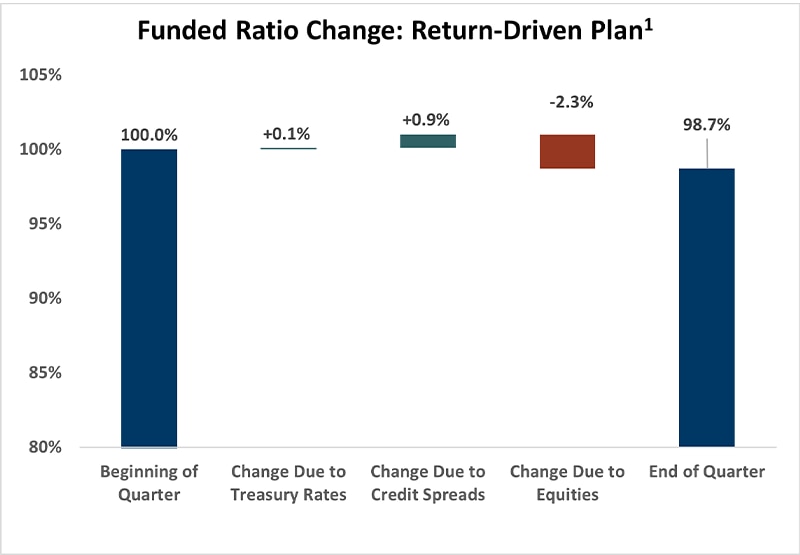
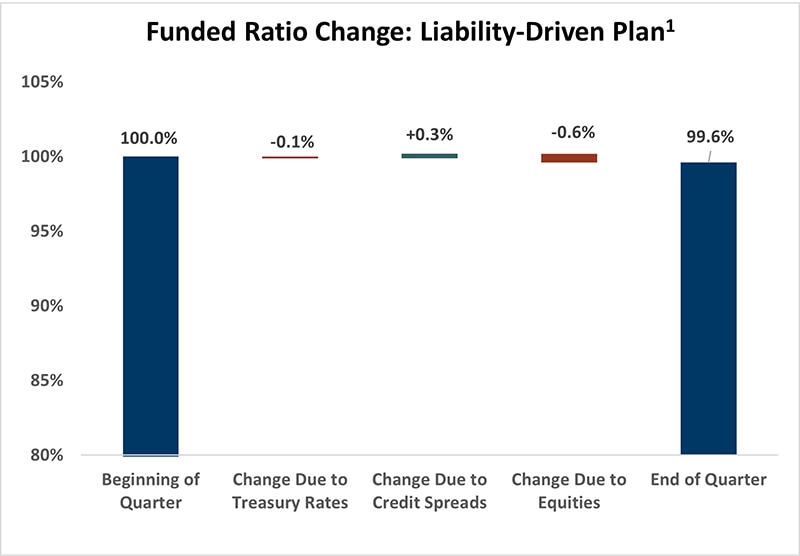
Corporate defined benefit plan funded levels decreased during the first quarter of 2026. The primary drivers were negative returns in return-seeking asset classes. A typical return-driven plan had a 1.3% decrease in its funded ratio, while a typical liability-driven plan observed a 0.4% decrease. Return-driven plans with higher equity allocations saw a larger decrease in funded status due to the larger impact of negative equity returns on the assets.
Chart 1: Funded Ratio Change: Return-Driven Plan1
View accessible version of this chart.
Chart 2: Funded Ratio Change: Liability-Driven Plan1
View accessible version of this chart.
Treasury Rates
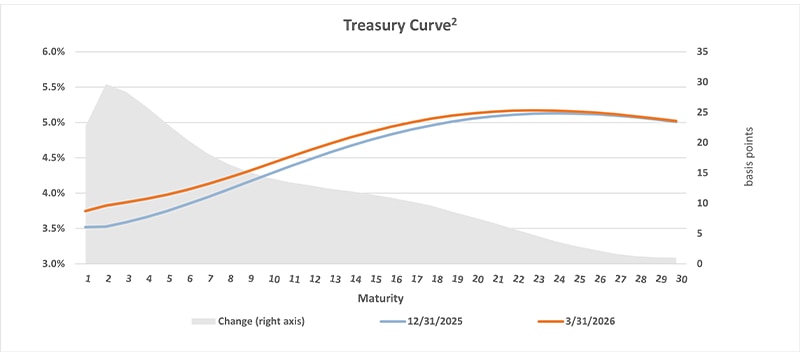
Treasury rates increased and had a mixed impact on funded status.
During the quarter, the Treasury curve flattened unevenly with rates increasing along the short end and remaining relatively flat at the long end of the yield curve. The short end of the curve increased approximately 20-30 basis points (bps), while the long end of the curve increased more modestly by approximately 1-15 bps. In isolation, the modest increase in long‑duration Treasury rates resulted in a small reduction in liabilities, modestly improving funded ratios for return‑driven plans, while the uneven curve shift led to minor hedge mismatch and a slight funded ratio decline for liability‑driven plans.
Chart 3: Treasury Curve2
View accessible version of this chart.
Credit Spreads
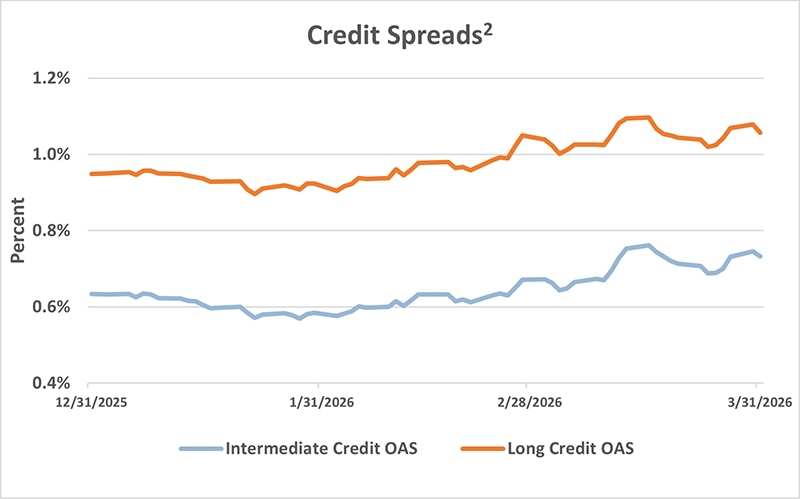
Credit spreads widened and had a positive impact on funded status.
Widening credit spreads increased the discount rates and decreased liabilities. Intermediate duration credit spreads widened 10 bps while long duration credit spreads widened 11 bps. The overall increase in spreads was driven by lower risk appetite due to geopolitical uncertainty that led to investor demand for additional compensation despite the Federal Reserve holding rates steady during the quarter. On a net basis, considering increasing Treasury yields, the total corporate bond discount rate for pensions increased approximately 24 bps and decreased plan liabilities.
Chart 4: Credit Spreads2
View accessible version of this chart.
Equities
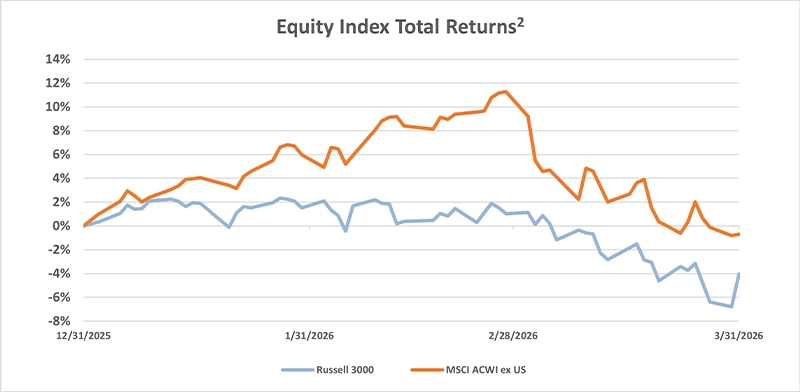
Equity market performance had a negative impact on funded status.
Overall negative performance in global equity markets decreased funded statuses this quarter, driven by valuation compression due to the market pricing in the higher for longer rate environment along with briefly increased volatility due to geopolitical tensions. U.S. large cap stocks underperformed U.S. small cap stocks with returns of approximately -4.33% and 0.89%, respectively. International equities outperformed domestic equities and returned around -0.71%.
Chart 5: Equity Index Total Returns2
View accessible version of this chart.
1Assumptions
- Data as of 3/31/2026, Source: PNC.
- The funded ratio changes are for generic plans with allocation and liability profiles specified below. Results are market driven and do not incorporate any plan-specific effects, such as benefit payments, expenses, benefit accruals, or plan contributions. Funded ratio changes are sensitive to the beginning of the period funded ratio.
- A return-driven plan is a pension plan with an asset allocation commonly associated with an absolute return-objective and has a high allocation to return-seeking assets (public equity in this case) and typically has high funded status volatility. Assumed asset allocation is 70% MSCI All Country World, 30% Bloomberg Aggregate.
- A liability driven plan is one that is well along its path in a liability-centric approach to investing and has a large allocation to long-duration bonds to help reduce funded status volatility. Assumed asset allocation is 20% MSCI All Country World, 64% Bloomberg Long Credit, 16% Bloomberg Long Government.
- Liability profile is based on BAML Mature/Average U.S. Pension Plan AAA-A Corp Indexes with average duration of 12.8 years.
2Data as of 3/31/2026, Source FactSet®. FactSet® is a registered trademark of FactSet Research Systems Inc. and its affiliates.
Contact Us »
Accessible Version of Charts
Chart 1: Funded Ratio Change: Return-Driven Plan1
| Return-Driven Plan | Funded Ratio Change |
| Beginning of Quarter | 100.00% |
| Change due to Treasury Rates | 0.10% |
| Change Due to Credit Spreads | 0.90% |
| Change Due to Equities | -2.30% |
| End of Quarter | 98.70% |
Chart 2: Funded Ratio Change: Liability-Driven Plan1
| Liability-Driven Plan | Funded Ratio Change |
| Beginning of Quarter | 100% |
| Change due to Treasury Rates | -0.1% |
| Change Due to Credit Spreads | 0.3% |
| Change Due to Equities | 0.6% |
| End of Quarter | 99.6% |
Maturity |
12/31/25 |
3/31/26 |
Change (right axis) |
1 |
3.52% |
3.75% |
0.23 |
3 |
3.59% |
3.87% |
0.28 |
5 |
3.75% |
3.98% |
0.23 |
7 |
3.95% |
4.13% |
0.18 |
9 |
4.16% |
4.31% |
0.15 |
11 |
4.37% |
4.51% |
0.14 |
13 |
4.58% |
4.70% |
0.12 |
15 |
4.75% |
4.85% |
0.10 |
17 |
4.90% |
5.00% |
0.10 |
19 |
5.01% |
5.10% |
0.09 |
21 |
5.09% |
5.15% |
0.06 |
23 |
5.17% |
5.17% |
0.00 |
25 |
5.16% |
5.16% |
0.00 |
27 |
5.12% |
5.12% |
0.00 |
29 |
5.05% |
5.05% |
0.00 |
Date |
Intermediate Credit Option-Adjusted (OAS) |
Long Credit Option-Adjusted Spread (OAS) |
9/30/25 |
0.63 |
0.95 |
10/31/25 |
0.58 |
0.92 |
11/30/25 |
0.67 |
1.05 |
12/31/25 |
0.73 |
1.06 |
Chart 5: Equity Index Total Returns2
| Index | Date | Percent |
| Russell 3000 | 12/31/2025 | 0.95% |
| 1/31/2026 | 1.53% | |
| 2/28/2026 | 1.01% | |
| 3/31/2026 | -4.05% | |
| MSCI ACWI ex USA | 12/31/2025 | 0.00% |
| 1/31/2026 | 5.98% | |
| 2/28/2026 | 11.30% | |
| 3/31/2026 | -0.71% |