Strong market performance leads to continued endowment growth
FY25 delivered strong investment performance, with average one-year returns (equally weighted across all 657 institutions) reaching 10.9% net of fees. These returns were supported by robust global equity markets, with the S&P 500® up 15.2% for the year. Looking slightly longer term, total annualized return on the same basis for the three- and five-year periods rose to 10.0% and 10.2%, respectively.
As in previously strong cycles, the total endowment market value increased to 7.5% year over year (y/y). Notably, smaller endowments experienced the fastest percentage growth, while the largest institutions captured the greatest dollar gains.
Diversification remains trendy
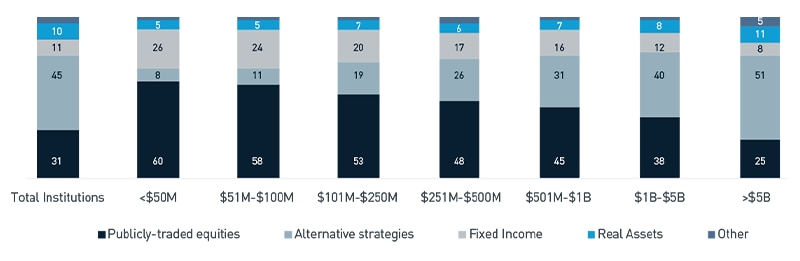
Endowments maintained broadly diversified allocations (Figure 1). On average, public equities accounted for just over 31%, 54% was allocated to private/alternative strategies (including real assets) and 11% to fixed income. Public equities continued to drive performance, especially developed non-U.S. and global equities. Fixed income allocations edged higher to 10.7% as institutions positioned for moderating inflation and stable interestrate expectations.
Institutions favored active management across U.S., non-U.S. and global equities in FY25; however, active U.S. equity use declined. Fixed income remained largely investment grade, with little year-over-year change.
Increasing reliance on endowment due to rising costs and declining revenue
Rising operating costs, inflation, federal funding cuts and declining revenue increased reliance on endowment spending in FY25 to a historic high—an 11% increase from the previous year. A decline in student enrollment remains a top concern for colleges and universities, especially among private institutions. With affordability as a driving factor behind the decline, institutions must offer more financial aid and scholarships without raising tuition. Higher education institutions funded an average of 15.2% of their operating budgets from endowments, with nearly half directed to student financial aid— three times more than what was spent on academic programs and research. Fewer college-aged students and waning trust in higher education institutions further compounded the issue, as did policy changes and visa disruptions which led to significant loss of international students who provide high-margin tuition revenue.
While effective spending rates remained stable at around 4.9%, the upward trend in operating reliance highlights vulnerabilities during periods of market volatility or declining gift flows. The majority of institutions calculated their spending as a percentage of a moving average of the endowment’s market value (Figure 2).
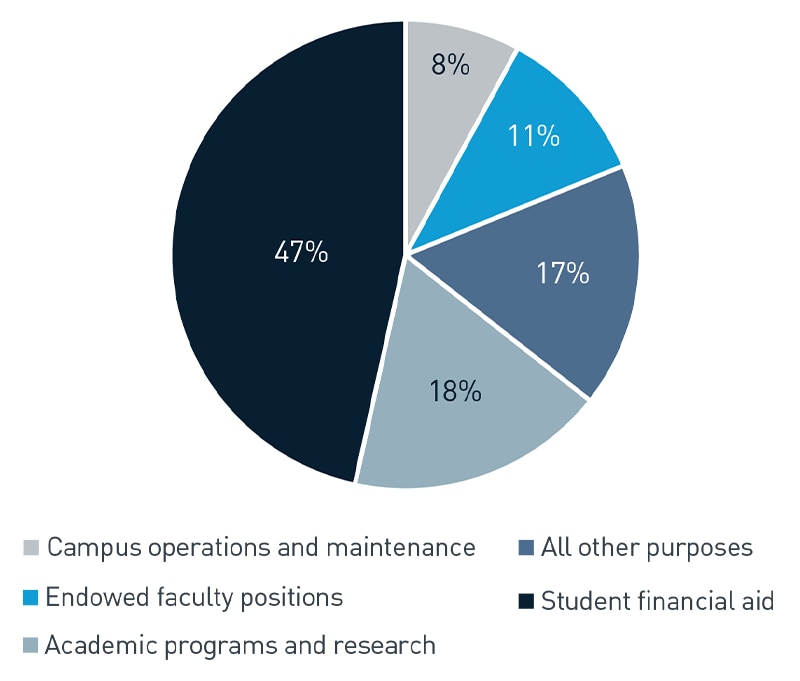
Figure 2: Spending Policy Distributions by Purpose
View accessible version of this chart.
Donations decline
Despite the strong returns and economic growth of the past three years, endowment contributions have waned. New gifts to endowments declined by 9.2% y/y, with endowments with assets under $50 million reporting a 26% decline. Median gift size rose slightly; however, the average gift amount fell, suggesting fewer large transformational contributions. With declines reported in two of the past three years, investment committees have prioritized monitoring fundraising momentum, especially for organizations reliant on endowment growth to support future spending.
According to the 2025 GivingUSA report, giving to educational causes amounted to 14% of total giving in 2024, making it the third largest subsector to receive philanthropic support. Nearly half of all endowed gifts were restricted for financial aid, and roughly 43% to research. The report highlighted that older generations (Silent and Baby Boomers) give the most in terms of dollars, and that alumni engagement, volunteer opportunities, social media and peer fundraising campaigns can raise more dollars among younger alumni.[1]
Use of an OCIO is most popular among small- and mid-size endowments
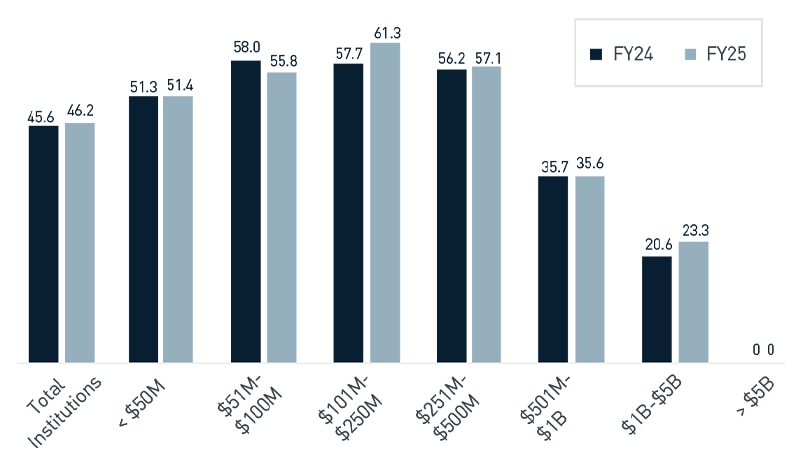
Most common among small- and mid-size endowments, 46.2% of institutions use an Outsourced Chief Investment Officer (OCIO) model (Figure 3). OCIO use remains high even for sizable asset pools. Use consistently exceeds 50% for organizations with assets up to $500M. This is largely due to the fact that institutions with larger endowments have the capacity to manage investments in house.
Top of mind issues for leadership: Responsible investing adoption seems to have fallen off the agenda for many leaders. Environmental, social and governance integration was reported by 27.1% of institutions, while 63.7% reported no active responsible investing practice. Although the One Big Beautiful Bill Act expanded the excise tax on the net investment income of university endowments—commonly referred to as the endowment tax, which takes effect this year—this matter is not currently considered a primary concern by most universities. However, many leaders are focused on long-term financial stability and policy uncertainty makes long-term planning more difficult.
Endowments as a tool for financial sustainability and stability
Endowments can be important financial tools for colleges and universities. They provide stable, long-term financial support that helps offset fluctuations in enrollment, fundraising and federal funding. Also, because an institution’s credit rating is closely tied to the reliability of these revenue streams, a strong and steady endowment is a key contributor to overall financial health.
The higher education sector faces growing pressures—rising operating dependence, slowing gift flows and increasing portfolio complexity. These challenges underscore the need for strong governance, disciplined risk management and strategic planning. Alignment across leadership—from the board to the c-suite—is essential. The entirety of an organization’s capital, not just the endowment, must be managed holistically and structured optimally with consideration for addressing risk and liquidity needs.
To strengthen long-term resilience, leaders should be clear on their financial picture over the next three to five years and ask:
- What trends are we seeing? (Decreasing enrollment, rising costs, policy changes, loss of funding?)
- What unexpected expenses may arise, and do we have adequate reserves and liquidity to absorb them?
- Is our investment policy statement (IPS) up to date and aligned with our risk tolerance and long-term objectives?
- Does our spending policy support current organizational needs while preserving long-term purchasing power?
- Is our investment provider aligned with our strategy and engaging with us regularly as needs evolve?
Business model challenges, funding and policy disruptions and increasing reliance on endowments all underscore the need for a strong IPS, well-aligned investment team and effective governance. By applying lessons from the higher education sector, nonprofit investment committees can position their organizations for long-term resilience, aligning mission needs with prudent investment strategy in an era defined by both opportunity and uncertainty.
Let's build your brilliant
PNC’s Nonprofit Strategy & Solutions group serves as a dedicated partner committed to empowering nonprofit organizations to achieve their missions. By combining national expertise with local knowledge, we provide comprehensive education and advice on governance, philanthropy and financial sustainability—going beyond asset management to deliver actionable insights that address the most pressing challenges nonprofits face. With our deep community ties, practical nonprofit leadership experience and strong local market presence, we provide meaningful solutions that optimize resources and deliver a sustainable impact. For more information, contact the team at IAMNonprofitStrategy@pnc.com.
Accessible Version of Charts
| Type of Asset | Total Institutions | Under $50M | $51M-$100M | $101M-$250M | $251M-$500M | $501M-$1B | $1B-$5B | Over $5B |
| Publicly-traded equities | 31 | 60 | 58 | 53 | 48 | 45 | 38 | 25 |
| Alternative strategies | 45 | 8 | 11 | 19 | 26 | 31 | 40 | 51 |
| Fixed Income | 11 | 26 | 24 | 20 | 17 | 16 | 12 | 8 |
| Real Assets | 10 | 5 | 5 | 7 | 6 | 7 | 8 | 11 |
| Other | 3 | 1 | 2 | 1 | 3 | 1 | 2 | 5 |
| Purpose | Percent |
| Campus operations and matainence | 8% |
| Endowed faculty positions | 11% |
| All other purposes | 17% |
| Academic programs and research | 18% |
| Student financial aid | 47% |
| Fiscal Year | Total Institutions | Under $50M | $51M-$100M | $101M-$250M | $251M-$500M | $501M-$1B | $1B-$5B | Over $5B |
| FY24 | 45.6 | 51.3 | 58 | 57.7 | 56.2 | 35.7 | 20.6 | 0 |
| FY25 | 46.2 | 51.4 | 55.8 | 61.3 | 57.1 | 35.6 | 23.3 | 0 |