
Following record donation levels in 2025, the underlying data points to important shifts in the philanthropic landscape. Long-term trends suggest that changes in donor behavior, wealth accumulation and institutional giving are influencing how charitable dollars are raised and distributed.
As the composition of philanthropy evolves, thoughtful consideration must be given to who is driving growth and the factors influencing allocation. Nonprofit organizations that understand these shifts may be better positioned to navigate an increasingly complex fundraising environment.
For nonprofit leaders, understanding these dynamics is as crucial as understanding the giving totals themselves. The trends highlighted in the 2025 report can help inform decisions around fundraising strategy, donor engagement and long-term organizational sustainability.
Key Takeaways
- Charitable giving reached a record $617.2 billion in 2025, reflecting continued support for nonprofit organizations across the country.
- Philanthropy continues to evolve as foundations, bequests and other institutional sources of capital play an increasingly critical role in overall giving.
- Economic conditions remained supportive of philanthropy in 2025, drawing attention to the relationship between donor capacity, fundraising activity and charitable outcomes.
- Long-term success depends on more than fundraising performance. Organizations must also adapt to changing donor behaviors, funding sources and operating conditions.
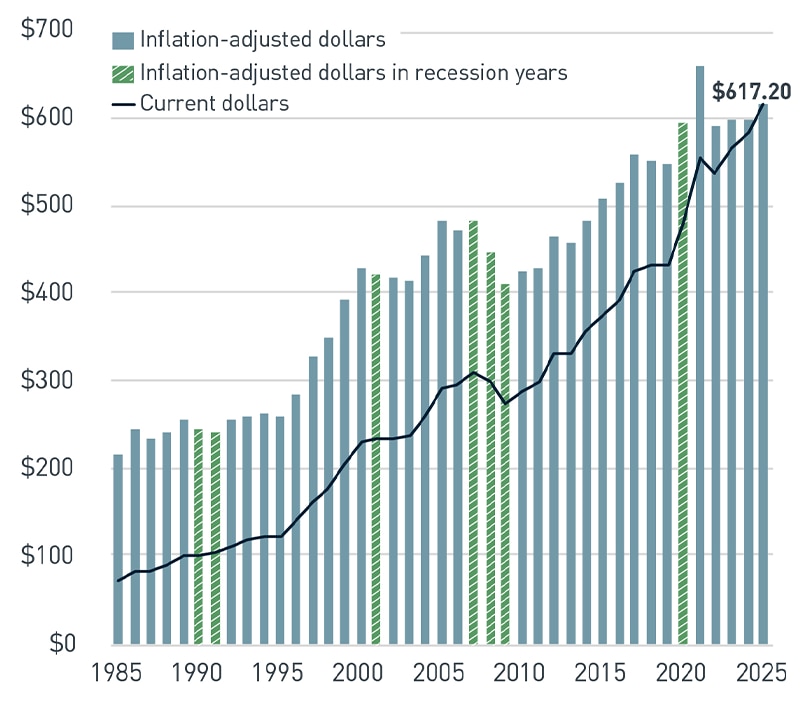
Figure 1. The Numbers Behind the Headlines
Total Giving, 1985 - 2025 in billions
Source: Giving USA 2026
Giving is growing, but costs are too
Charitable giving reached a record high in 2025, increasing 5.7% in current dollars and 3.0% after adjusting for inflation. The growth marked another year of real expansion for the philanthropic sector and reflected continued generosity from donors across a range of giving sources. Viewed in a historical context, charitable giving has remained remarkably consistent, increasing or holding steady in current dollars in all but four years since 1985.
While the headline growth figures are encouraging, the distinction between current dollar and inflation-adjusted growth remains relevant. Stronger fundraising results may not translate to greater organizational capacity in the face of rising operating costs.
Which forces are shaping philanthropy?
| Tailwinds | Headwinds |
| Strong equity market performance | Rising operating costs |
| Growth in disposable personal income | Inflationary pressures |
| Record foundation giving | Competition for charitable dollars |
| Increased bequest giving | Donor participation challenges |
| Continued wealth creation | Policy and tax uncertainty |
The philanthropic environment benefited from several favorable conditions in 2025. Financial markets remained strong, and disposable personal income and charitable giving increased across most subsectors. These factors helped support donor confidence and charitable capacity, contributing to another year of growth for the sector.
During this period, nonprofit organizations continued to navigate a challenging operating environment. Rising costs, increasing competition for donor attention, evolving donor preferences and ongoing policy uncertainty remain meaningful considerations for fundraising leaders. While giving results were positive overall, many organizations face mounting pressure on both the revenue and expense sides of their operations.
Understanding these competing forces can help explain why certain organizations or subsectors have experienced stronger fundraising outcomes than others. They also provide context for assessing whether recent giving trends are likely to persist going forward.
Who is driving donations?
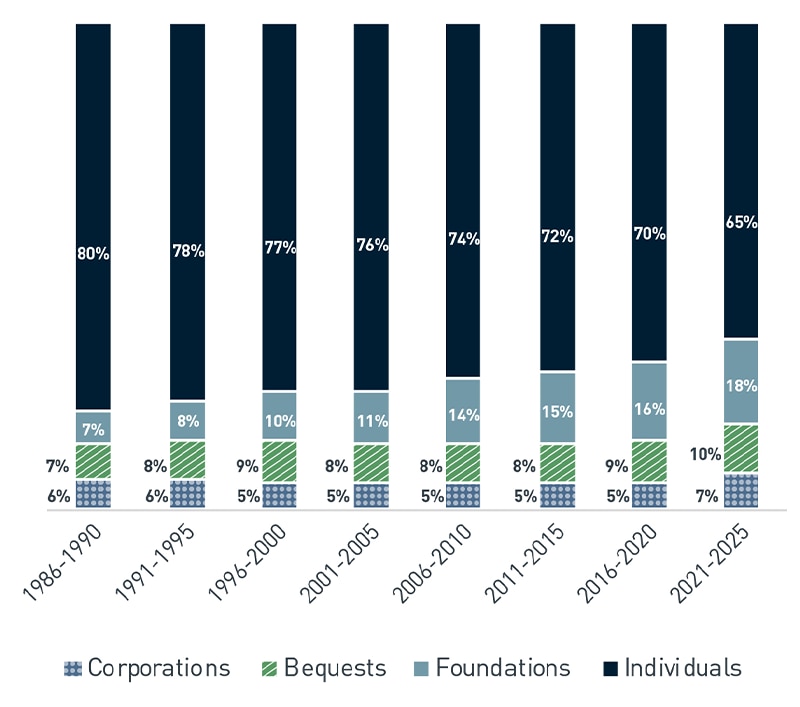
Figure 2: The Changing Philanthropic Landscape
Giving by Source: Percentage of the total, 1985-2025*
*Totals may not add to 100% due to rounding.
Source: Giving USA 2026
Although individuals remain the largest source of charitable giving, long-term Giving USA data illustrates that the composition of philanthropy has evolved over time. Over the past four decades, individual giving has declined as a percentage of total charitable giving, while foundations and bequests have steadily increased their share.
Most recently, individuals represented 65% of charitable giving, compared with 80% in the late 1980s, while foundations grew from 7% to 18% of total giving.
This trend does not suggest that individual donors are becoming less important. Rather, it highlights the growing influence of other sources of philanthropic capital, including foundation assets, planned gifts and large donor contributions. This year, foundation giving reached a record level in 2025, bequest giving experienced significant growth and more than $19 billion in mega gifts were reported. As these funding sources continue to expand, they account for a larger share of overall charitable giving.
Evidence of this shift can also be seen in affluent donor behavior. While total contributions from affluent households increased more than 30% over the past decade, the share of affluent households making charitable gifts declined from 91% in 2015 to 81% in 2024. The result is a philanthropic landscape shaped by fewer participants contributing a larger share of charitable dollars.
Is philanthropy shifting from broad participation to concentrated capital?
Giving USA has consistently noted a relationship between charitable giving and broader economic indicators, particularly financial market performance. In 2025, strong equity market returns, rising household wealth and growing foundation assets helped create favorable conditions for philanthropy. These trends demonstrate the influence donor circumstances have on giving outcomes.
At the same time, fundraising results are not determined by donor capacity alone. Organizations must still identify, cultivate and steward donors to translate philanthropic potential into philanthropic support.
Strong fundraising performance reflects both favorable market conditions and effective organizational strategy.
Questions for Nonprofit Leaders
- If a growing share of charitable dollars is coming from fewer donors, how exposed is our organization to donor concentration risk?
- Are our fundraising results driven primarily by favorable donor conditions, or by deliberate investment in fundraising capacity and donor relationships?
- What investments should we make today to ensure fundraising success across a variety of economic and market environments?
- How are we engaging different donor segments and tailoring our approach to what motivates them to give?
What are the implications for nonprofit leaders?
Meet donors where wealth resides: As foundations, bequests and non-cash assets play a larger role in philanthropy, organizations should ensure they are prepared to receive and manage these forms of giving. This may include evaluating planned giving programs and gift acceptance policies.
Diversify sources of support: Organizations should regularly assess their dependence on a limited number of funding relationships, as reliance on a small number of donors can create concentration risk. Charitable giving incentives may be reshaped by policy changes which further reinforce the value of maintaining a balanced mix of donors, gift types and revenue sources.
Understand donor motivations: Giving USA highlights meaningful differences across donor groups, making it essential to tailor engagement strategies to evolving donor preferences and expectations. Regular engagement with donors offers valuable perspective on how donor priorities and philanthropic interests are changing over time.
Plan beyond the current cycle: Changes in the composition of giving can create new opportunities, but organizations should avoid building strategies around current conditions alone. Long-term planning and financial resilience remain critical as donor behavior, economic conditions and sources of philanthropic capital continue to evolve.
Strategic Perspective: What is the best way forward?
From Arthur Mills IV, Director
PNC Nonprofit Strategy & Solutions Group
The trends highlighted in this year’s report underscore the importance of how development leaders invest their most limited resource: time. Perhaps the most critical question for nonprofit leaders is not whether overall giving will continue to grow, but whether their organization is positioned to capture that growth.
As philanthropic dollars become concentrated among fewer donors and institutions, fundraising success will increasingly hinge on relationship depth, donor sophistication and organizational credibility. For a new generation of donors, trust is earned through transparency, impact reporting and financial clarity. The challenge ahead is clear: leverage technology and efficiency to expand capacity while preserving the personal connections that ultimately inspire generosity.
 KEY INSIGHT: Now is the time for leaders to take a hard look at their fundraising strategy. Are you building the relationships, technical and adaptive capabilities and donor experiences required to compete for tomorrow's philanthropic capital? The organizations that answer that question proactively today will be the ones best positioned to turn evolving donor trends into sustained mission impact.
Nonprofit Strategy & Solutions Group
PNC’s Nonprofit Strategy & Solutions group serves as a dedicated partner committed to empowering nonprofit organizations to achieve their missions. By combining national expertise with local knowledge, we provide comprehensive education and advice on governance, philanthropy and financial sustainability — going beyond asset management to deliver actionable insights that address the most pressing challenges nonprofits face. With our deep community ties, practical nonprofit leadership experience and strong local market presence, we provide meaningful solutions that optimize resources and deliver a sustainable impact.
For more information, contact the team at IAMNonprofitStrategy@pnc.com.
TEXT VERSION OF CHARTS
Figure 1: Figure 1. The Numbers Behind the Headlines (view image)
Total Giving, 1985 - 2025 in billions
| Year | Inflation-adjusted dollars | Current dollars | Recession Year |
| 1985 | $214.57 | $71.69 | No |
| 1986 | $244.52 | $83.25 | No |
| 1987 | $232.90 | $82.20 | No |
| 1988 | $239.68 | $88.04 | No |
| 1989 | $255.29 | $98.30 | No |
| 1990 | $242.66 | $98.48 | Yes |
| 1991 | $242.49 | $102.58 | Yes |
| 1992 | $255.34 | $111.29 | No |
| 1993 | $259.81 | $116.58 | No |
| 1994 | $260.75 | $120.05 | No |
| 1995 | $260.08 | $123.10 | No |
| 1996 | $285.08 | $138.89 | No |
| 1997 | $325.84 | $162.46 | No |
| 1998 | $348.71 | $176.56 | No |
| 1999 | $392.71 | $203.19 | No |
| 2000 | $429.37 | $229.66 | No |
| 2001 | $421.99 | $232.09 | Yes |
| 2002 | $416.53 | $232.72 | No |
| 2003 | $415.56 | $237.45 | No |
| 2004 | $443.60 | $260.26 | No |
| 2005 | $482.08 | $292.43 | No |
| 2006 | $472.86 | $296.09 | No |
| 2007 | $482.99 | $311.06 | Yes |
| 2008 | $448.01 | $299.61 | Yes |
| 2009 | $412.35 | $274.78 | Yes |
| 2010 | $425.45 | $288.16 | No |
| 2011 | $427.23 | $298.50 | No |
| 2012 | $466.39 | $332.61 | No |
| 2013 | $456.94 | $330.64 | No |
| 2014 | $483.24 | $355.35 | No |
| 2015 | $506.88 | $373.17 | No |
| 2016 | $526.27 | $392.33 | No |
| 2017 | $557.55 | $424.51 | No |
| 2018 | $552.95 | $431.29 | No |
| 2019 | $546.56 | $434.03 | No |
| 2020 | $595.76 | $478.94 | Yes |
| 2021 | $660.76 | $556.14 | No |
| 2022 | $591.59 | $537.77 | No |
| 2023 | $599.35 | $567.25 | No |
| 2024 | $599.22 | $583.86 | No |
| 2025 | $617.20 | $617.20 | No |
Source: Giving USA 2026
Figure 2: The Changing Philanthropic Landscape (view image)
Giving by source: Percentage of total, 1985 - 2025*
| Year | Individuals | Foundations | Bequests | Corporations |
| 1986-1990 | 80% | 7% | 7% | 6% |
| 1991-1995 | 78% | 8% | 8% | 6% |
| 1996-2000 | 77% | 10% | 9% | 5% |
| 2001-2005 | 76% | 11% | 8% | 5% |
| 2006-2010 | 74% | 14% | 8% | 5% |
| 2011-2015 | 72% | 15% | 8% | 5% |
| 2016-2020 | 70% | 16% | 9% | 5% |
| 2021-2025 | 65% | 18% | 10% | 7% |
Source: Giving USA 2026