
Strong profits do not always translate into lasting value. Josef Guevarra, Managing Director, PNC Corporate Advisory, examines how leaders can use value creation to guide investment and growth decisions.
Would you rather run a profitable business or one that creates value?
It sounds like a trick question. But in corporate finance, it isn't.
A profitable business generates earnings, reflected through metrics such as revenue, margins, Earnings Before Interest, Taxes, Depreciation, and Amortization (EBITDA), and net income. These measures provide a visible and consistent signal that a business is working.
A value-creating business goes a step further.
Value is driven by cash flows, but those cash flows require capital, and that capital comes at a real cost. As a result, true performance is not defined by profits alone, but by whether those profits are sufficient relative to the capital deployed to generate them.
Profitability tells you the business is working. Value creation tells you whether it's worth it.
En otras palabras:
- Profitability measures whether a company makes money.
- Value creation measures whether it makes enough to justify the capital it consumes.
If profitability is not the endpoint, what prevents companies from taking the final step?
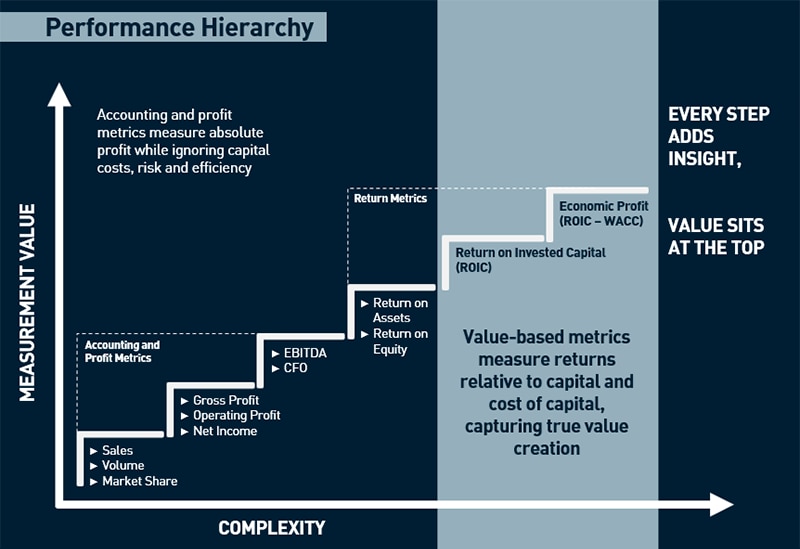
Figure 1: Performance Hierachy
Ver la versión accesible de este gráfico.
Why Companies Get Stuck in Profitability?
Most organizations successfully move from scale metrics, such as sales, volume, and market share, to profitability metrics like EBITDA and net income. Yet profitability often sits in the middle of the performance hierarchy, not at the top. Few companies make the leap to a truly value-based evaluation framework.
One reason is simple: value-based metrics are harder to measure.
As a result, organizations often default to what is easier to measure, easier to explain, and easier to manage, even if it provides an incomplete view of performance.
While value-based evaluation may be more involved, it often provides deeper insight into the drivers of long-term performance. At a high level, the concept is straightforward.
The Core Value Creation Framework
At its core, value creation comes down to a simple equation:
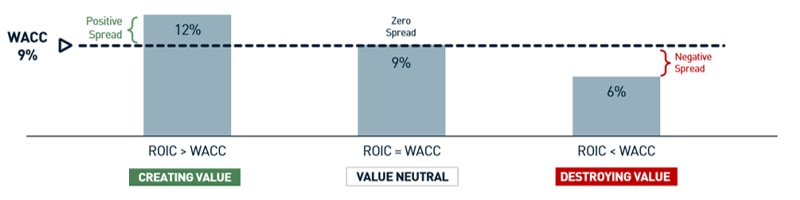
Economic Profit/Loss = (ROIC − WACC)
- Return on Invested Capital (ROIC): Profit generated per dollar invested in the business.
- Weighted Average Cost of Capital (WACC): The minimum return required by capital providers.
The relationship between ROIC and WACC determines whether value is created or diminished.
This framework shifts the conversation from "How much did we earn?" to "Was it worth the capital required?"
Ver la versión accesible de este gráfico.
The Profitability Trap
Another factor that keeps companies focused on profitability is the tendency to treat it as the ultimate measure of success.
Once margin targets are met, earnings grow, and EBITDA improves, results are rewarded, reinforcing the perception of success. But that sense of success can sometimes be misleading.
Consider a company with strong margins, growing earnings, and positive cash flow:
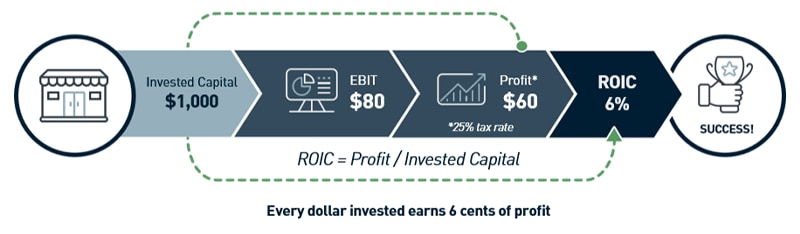
Figure 3: ROIC resulting from $1,000 of invested capital
Ver la versión accesible de este gráfico.
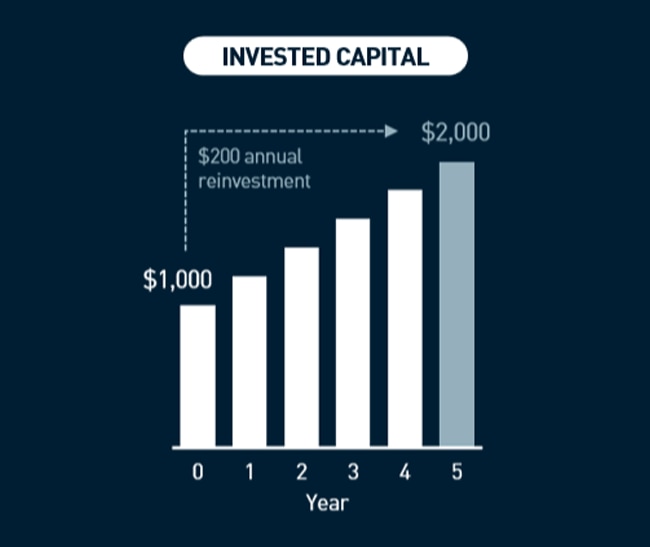
On paper, performance appears solid. To sustain growth, however, the company continues to reinvest capital back into the business. If the returns generated by those investments fail to exceed the cost of capital, value creation may lag even as earnings continue to grow.
The result is a powerful illusion: earnings expand, growth is rewarded, yet the business may not be creating value at the same pace.
Ver la versión accesible de este gráfico.
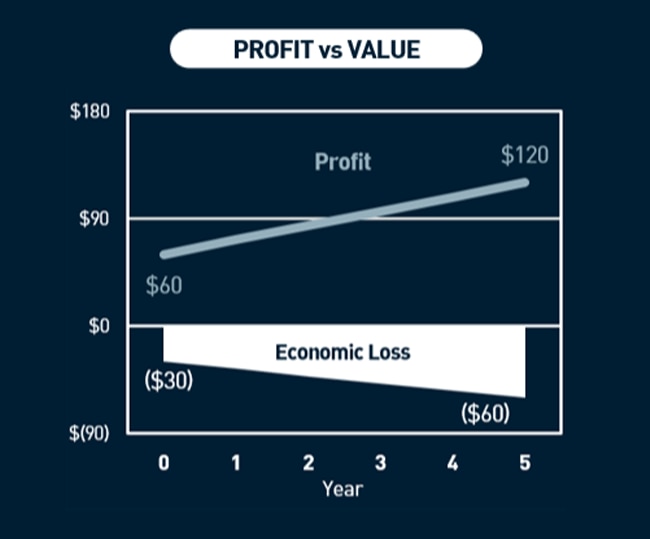
Ver la versión accesible de este gráfico.
How Value Creation Drives Better Decisions
Understanding the concept is only the starting point. Its real power emerges when it becomes part of decision-making.
The same framework used to evaluate performance can also guide strategic choices across the organization.
| Use Case | Key Questions | Solicitud | Decision Anchor |
| Capital Allocation | Where to invest? | ∙Priortize high positive spread ∙Avoid funding sub-economic return projects | Capital flows to the highest value-creating uses, not just the bigger or fastest growing |
| M&A / Growth Strategy | Is growth worth it? | ∙Evaluate deal / project ROIC vs corporate WACC ∙ Include synergies, M&A costs, and time horizon | Reject deals if returns do not exceed cost of capital, even if earnings accretive |
| Business Unit Management | Grow, maintain, or depriortize? | ∙Rank business units by ROIC – WACC spread ∙ Identify positive, zero, and negative spread | Reallocate capital from value-destructive to value-accretive businesses |
| Management Evaluation | Is management creating value? | ∙ Evaluate performance via economic profit ∙ Focus on returns, not just earnings growth | Hold management accountable for capital efficiency and value-creation |
| Investor Communication | How to tell the value story? | ∙ Frame performance as ROIC vs WACC ∙Highlight economic profit generation | Shift narrative from earnings growth to value creation |
Importantly, the inputs behind ROIC and WACC are not one -size -fits-all; they require clear definitions and thoughtful calibration to ensure consistent application across the business.
Building a Value Creation Operating System
The value creation operating system translates the ROIC-WACC framework into a practical set of management disciplines. Its purpose is to ensure capital is deployed intentionally, performance is evaluated consistently, and value creation becomes part of day-to-day decision-making. Here’s a practical approach:
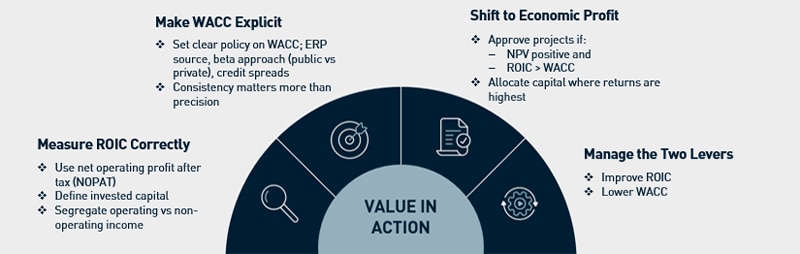
Ver la versión accesible de este gráfico.
The framework provides clarity, but its impact depends on how rigorously it is applied.
Organizations that consistently create value do not simply understand the rules. They embed them into how they operate.
En resumen
Profitability is relatively easy to measure.
Value creation is what differentiates organizations that generate sustainable long-term performance.
Companies that consistently create value recognize that strong earnings alone are not enough.
They focus on generating returns that exceed the cost of capital and embed that discipline into investment decisions, performance management, strategy development, and capital allocation.
Construyamos su brillante visión
PNC Corporate Advisory supports clients through strategic dialogue to assess key priorities, evaluate options, and guide decisions that align with corporate and shareholder objectives to help drive long-term value.
Download the full report.
Looking Beyond Profitability: Why Value Creation Completes the Picture
Versión accesible de los gráficos
Gráfico 1. Performance Hierarchy
The Performance Hierarchy graphic illustrates various metrics to evaluate business performance ranging from accounting and profit metrics which sit towards the bottom in terms of measurement value to return metrics which are at the top of the measurement value hierarchy. As metrics' measurement value increases, their respective complexity also increases.
Accounting and Profit Metrics (listed from lowest to highest measurement value and complexity)
Accounting and profit metrics measure absolute profit while ignoring capital costs, risk and efficiency.
- Ventas
- Volumen
- Participación en el mercado
- Gross Profit
- Operating Profit
- Ingresos netos
- EBITDA
- CFO (flujo de caja optimizado)
Return Metrics (listed from lowest to highest measurement value and complexity starting just above CFO)
- Return on Assets
- Return on Equity
Value-based metrics measure returns relative to capital and cost of capital, capturing true value creation
- Return on Invested Capital (ROIC)
- Economic Profit (ROIC minus WACC)
Every step adds insight; value sits at the top.
Figura 2. Examples of outcomes for differing ROIC values versus WACC
The bar chart illustrates 3 scenarios for economic profit or loss when WACC is 9%.
ROIC = 12% (positive spread)
When ROIC is greater than WACC, value is created.
ROIC = 9% (zero spread)
When ROIC is equal to WACC, value remains neutral.
ROIC = 6% (negative spread)
When ROIC is less than WACC, value is destroyed.
Figure 3: Flow chart showing the ROIC resulting from $1,000 of invested capital
ROIC = Profit / Invested Capital
- Invested Capital: $1,000
- EBIT: $80
- Profit: $60 (25% tax rate)
ROIC: 6%.
Outcome is success. Every dollar invested earns 6 cents of profit.
Bar chart showing illustrative scenario with a beginning value of $1000 and a $200 annual reinvestment made in years 1 through 5, resulting in $2000 total value at the end of the period.
| Use Case | Key Questions | Solicitud | Decision Anchor |
| Capital Allocation | Where to invest? | ∙Priortize high positive spread ∙Avoid funding sub-economic return projects | Capital flows to the highest value-creating uses, not just the bigger or fastest growing |
| M&A / Growth Strategy | Is growth worth it? | ∙Evaluate deal / project ROIC vs corporate WACC ∙ Include synergies, M&A costs, and time horizon | Reject deals if returns do not exceed cost of capital, even if earnings accretive |
| Business Unit Management | Grow, maintain, or depriortize? | ∙Rank business units by ROIC – WACC spread ∙ Identify positive, zero, and negative spread | Reallocate capital from value-destructive to value-accretive businesses |
| Management Evaluation | Is management creating value? | ∙ Evaluate performance via economic profit ∙ Focus on returns, not just earnings growth | Hold management accountable for capital efficiency and value-creation |
| Investor Communication | How to tell the value story? | ∙ Frame performance as ROIC vs WACC ∙Highlight economic profit generation | Shift narrative from earnings growth to value creation |
| Año | Accounting Profit | Economic Value (Loss) |
|---|---|---|
| 0 | $60 | ($30) |
| 5 | $120 | ($60) |
Although accounting profit increases from $60 to $120 over five years, economic value declines from an economic loss of $30 to an economic loss of $60. The chart illustrates that rising profits do not necessarily create value if economic performance deteriorates.
The chart highlights four practices that drive value creation:
1. Measure ROIC Correctly
- Use net operating profit after tax (NOPAT).
- Define invested capital.
- Separate operating income from non-operating income.
2. Make WACC Explicit
- Establish a clear policy on Weighted Average Cost of Capital (WACC), including:
- ERP source
- Beta approach (public vs. private)
- Diferenciales de crédito
- Consistency is more important than precision.
3. Shift to Economic Profit
- Approve projects only if:
- Net Present Value (NPV) is positive, and
- Return on Invested Capital (ROIC) is greater than WACC.
- Allocate capital where returns are highest.
4. Manage the Two Levers
- Improve ROIC.
- Lower WACC.
All four practices work together to create Value in Action by improving how investments are evaluated, capital is allocated, and financial performance is measured.