
Lower-income consumer spending rebounding, AI adoption accelerating, and U.S. fiscal position deteriorating – perspectives on these and other key economic themes from PNC’s research teams and subject matter experts
-Gagan Singh, Chief Investment Officer and Head of Economics Research
The U.S. economy remains resilient heading into the second half of 2026. PNC continues to expect full-year real GDP growth of about 2.1%, with incoming data consistent with solid growth in the second quarter. A still-expanding labor market, rebounding consumer spending, AI-fueled capital expenditures, equity market wealth effects, and front-loaded fiscal support from the One Big Beautiful Bill Act have supported growth. The pullback in oil prices, with Brent crude now around $85/bbl, down from above $100 earlier in the year, should ease input-cost pressures and support household purchasing power, although energy prices remain vulnerable to geopolitical developments.
Inflation reaccelerated in the first half of the year, but recent data provide evidence that progress on disinflation may have resumed as tariff- and energy-related price pressures fade. Soft wage growth and easing input costs should temper core inflation, while sticky core services inflation remains the key risk. The June Federal Open Market Committee (FOMC) meeting under Chair Kevin Warsh marked a clear shift in the Fed’s messaging, with greater focus on upside inflation risks and greater willingness to tighten policy if needed. Our base case remains that the Fed holds its policy rate unchanged through year-end. Growth above potential, an economy near full employment, and inflation still above target weigh against rate cuts, while softer job growth and renewed inflation progress reduce the urgency for further tightening.
The consumer continues to surprise
A striking feature of the current economic environment is the continued strength of consumer spending. Despite persistent concerns about inflation, interest rates, and economic uncertainty, consumer spending remains near multi-year highs and continues to show momentum.
In June, total card spending accelerated to 6.2% year-over-year growth, the strongest pace in four years, while spending excluding gasoline increased 5.4%. Travel-related spending rebounded to more than 7% growth, approaching rates seen prior to recent geopolitical disruptions. Lower gasoline prices, spending related to events including the World Cup and Prime Day promotions, also provided support, although some moderation may occur as those effects fade.
Importantly, we see little evidence that the improvement in spending in 2026 has been accompanied by a meaningful deterioration in household balance sheet health. The percentage of households we estimate living “paycheck-to-paycheck” has remained stable in 2026 and slightly below pre-pandemic levels. Cash savings buffers have held up, even after adjusting for inflation.
What about debt? Here, the story is more mixed. Credit card balances have increased around 9% year-over-year (YoY) across all income cohorts in 2026, indicating that consumers are, to some degree, using debt to finance this improvement in spending. However, the starting point here matters. Average balances remain well below pre-pandemic levels after adjusting for inflation. Additionally, the percentage of credit card balances being paid off each month still remains above pre-pandemic levels. At the higher end of the income spectrum, wealth effects continue to provide support. Rising brokerage inflows, concentrated among older and higher-income households, are helping to sustain spending, even as the support from tax refunds gradually fades. Together, these trends suggest that consumer resilience remains broad-based, though supported by different factors across household segments.
Lower-Income Consumer Spending Growing
For much of the post-pandemic period, economic discussions centered on a K-shaped recovery in which higher-income households dramatically outperformed lower-income consumers. More recently, that divide has narrowed considerably. Excluding spending on gas, YoY spending by lower-income households accelerated from 1.7% at the end of 2025 to 4.9% in June, just shy of the 5.6% mark of upper-income households. That shift is an encouraging sign, because it suggests economic strength may be becoming more broadly distributed. However, questions remain about how durable the trend will prove to be.
Some of the recent support for lower-income households has come from factors that are unlikely to persist indefinitely, including tax refunds. A continued improvement in labor market conditions would provide a more sustainable foundation for spending growth and could determine whether this convergence becomes a lasting feature of the economy.
U.S. Fiscal outlook has worsened significantly over the last two decades
Federal deficits have expanded significantly over time, driven by a combination of rising spending, declining tax revenue, and the fiscal effects of two major recessionary shocks. Importantly, spending growth has been driven primarily by rising costs of entitlement programs rather than discretionary spending.
Long-term projections from the Congressional Budget Office show that deficits, debt relative to GDP, and interest costs will continue to rise over the coming decades. The primary risk is not an imminent funding crisis or sudden loss of market access, but rather a gradual repricing of U.S. fiscal risk through higher Treasury yields, wider term premia, and rising borrowing costs. Evidence suggests this process is already underway.
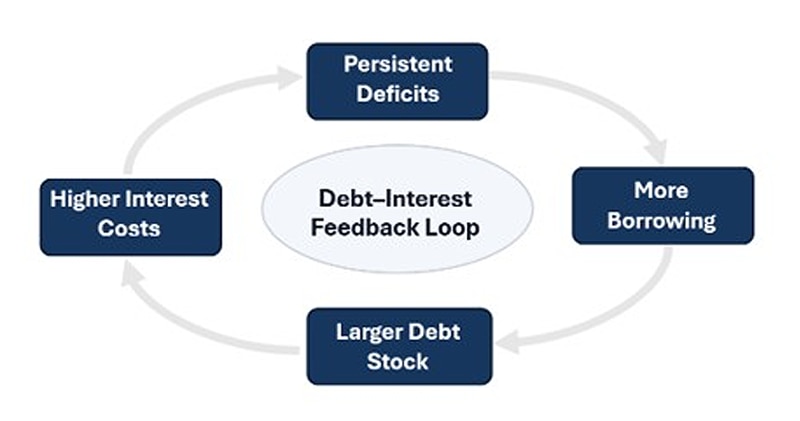
As debt levels increase, interest costs consume a growing share of federal resources, requiring additional borrowing to service both existing debt and to fund rising debt-service costs. The rise in interest costs is also reducing funds available for other fiscal priorities. Importantly, this dynamic creates a debt-interest feedback loop where persistent deficits require more borrowing, leading to larger debt stock, higher interest costs, and ultimately even higher deficits.
Figure 1. Debt-Interest Feedback Loop
Source: PNC. For illustrative purposes only.
View accessible version of this chart.
To be sure, the United States retains significant comparative advantages, including deep and liquid capital markets, reserve currency status, and substantial revenue capacity given its low effective tax rate, dynamic economy, and growing tax base. These advantages provide meaningful fiscal space today; however, the status quo is becoming increasingly costly and is likely to prove difficult to sustain. Putting the U.S. on a sound and sustainable path will require difficult policy choices on revenue increases and spending.
AI adoption is growing but still in early stages
AI and its growing impact have become dominant topics in policy discourse, media coverage, and corporate boardrooms, with many assuming that businesses are rapidly transforming their operations and that firms failing to act quickly risk being left behind. However, the reality is likely more measured.
Most organizations remain in the early stages of AI adoption and experimentation. While interest is widespread, current implementations are largely focused on improving efficiency, reducing administrative burdens, and streamlining routine workflows. Rather than fundamentally reinventing business models, present use of AI is primarily focused on making existing processes work better.
That reality differs from the public discussion, which is frequently focused on the most ambitious and transformative applications of AI. This contributes to a false impression that AI is transforming entire industries overnight, as opposed to the existing reality of relatively basic use cases. The perception gap is leading to a growing sense of fear of missing out from business leaders who may be unaware that many of their peers are facing the same challenges.
Over time, however, AI may create a meaningful divide between stronger and weaker organizations. Businesses with the resources, talent, and strategic discipline to successfully integrate AI could improve productivity, strengthen margins, and sharpen their competitive positioning. Those that fail to adapt may find it increasingly difficult to keep pace.
Figure 1: Debt-Interest Feedback Loop (view image)
In a Debt-Interest Feedback Loop: Persistent Deficits leads to More Borrowing, which leads to Larger Debt Stock, which leads to Higher Interest Costs.
Source: PNC. For illustrative purposes only.