

Colleges and universities face an evolving landscape. Expectations of tuition discounts, new models for instruction and learning, and questions about the value of a college degree mean higher education professionals face more obstacles than ever to prepare tomorrow’s leaders. At PNC Institutional Asset Management®, our Enterprise Financial Modeling solution provides higher education leaders with tools to enhance decision-making and improve long-term outcomes. Enterprise Financial Modeling unites operating strategy, financial health, and investment strategy. We find that investment assets can have a considerable impact on measures of organizational health, such as those related to liquidity and industry-specific metrics, like the Composite Financial Index (CFI)1, and could play a major role in executing capital projects and mission fulfillment.
How Enterprise Financial Modeling seeks to enhance decision-making
Enterprise Financial Modeling guides clients through a four-step process that begins with acquiring an intimate understanding of an institution’s goals and leads to implementing and monitoring a customized investment strategy.
1. Organizational goals & projections
Our modeling workflow begins with a questionnaire-guided discovery process to understand the role investment assets play in determining enterprise financial health. These investment asset pools include donor-restricted funds and quasi-endowments. We also explore key metrics that measure financial health, permissible asset classes, and planned spending from investment assets, among other topics relevant to the optimal investment strategy.
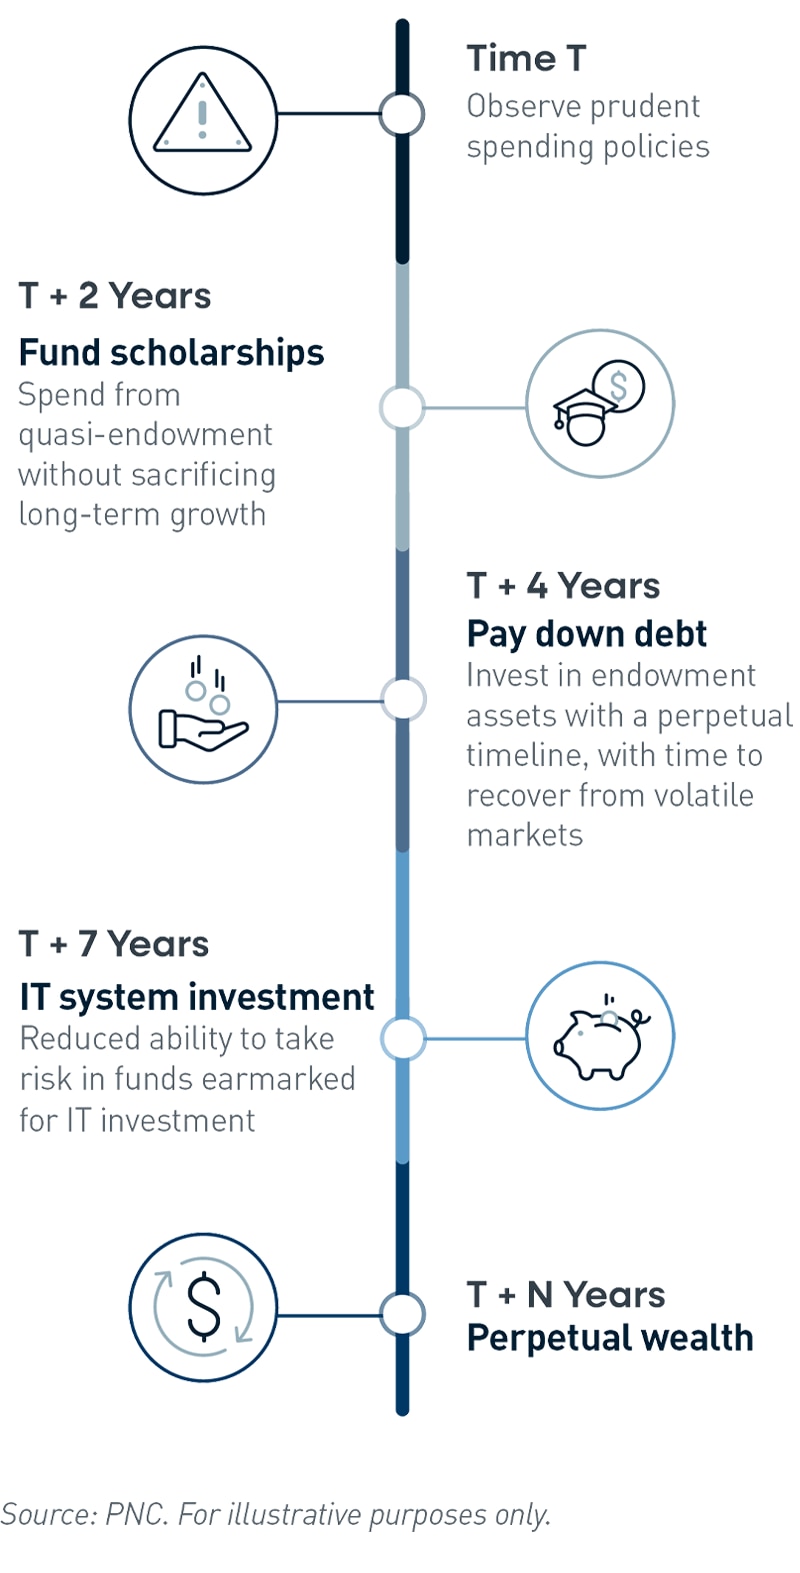
We review the institution’s strategic plans and financial projections to refine our foundational understanding of the organization’s financial health. This forward-looking review, which may include a discussion of planned financial commitments as illustrated in Figure 1, equips us with a financial backdrop with which to prepare a recommendation.
Figure 1: Sample Timeline of Financial Commitments
View accessible version of this chart.
2. Enterprise financial analysis
Step two unites investments with financial health. We seek to understand the influence of market volatility and different asset allocation profiles on the institution’s financial outlook. In practice, this means examining how favorable or challenging market environments and different investment risk postures within those environments might affect vital financial metrics, such as days cash on hand, cash and investments to debt, or DOE composite score.2
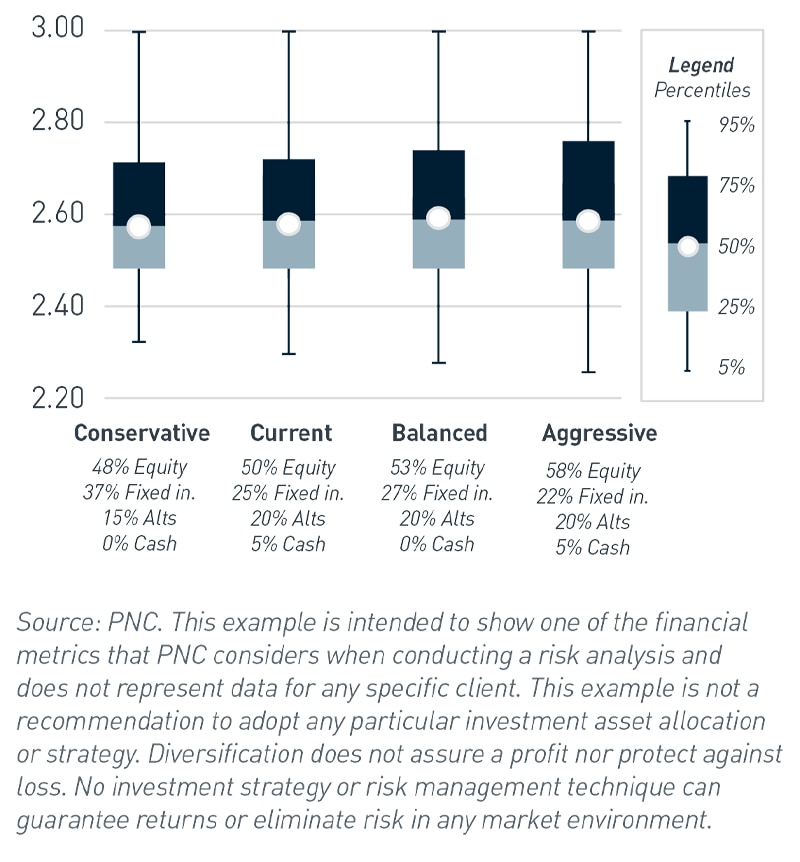
Figure 2 illustrates the output from our scenario analysis of one of these metrics, the DOE composite score, across different potential portfolio profiles. In this example, the magnitude of downside risk expands as the portfolio profile becomes more aggressive. Likewise, we also consider the financial health impact of capital spending funded from investments or debt. These insights can equip higher education leaders to better comprehend the school’s ability to tolerate investment risk and quantify the financial effect of the investment strategy.
Figure 2: Illustrative Example: DOE Composite Score
View accessible version of this chart.
3. Customized investment strategy
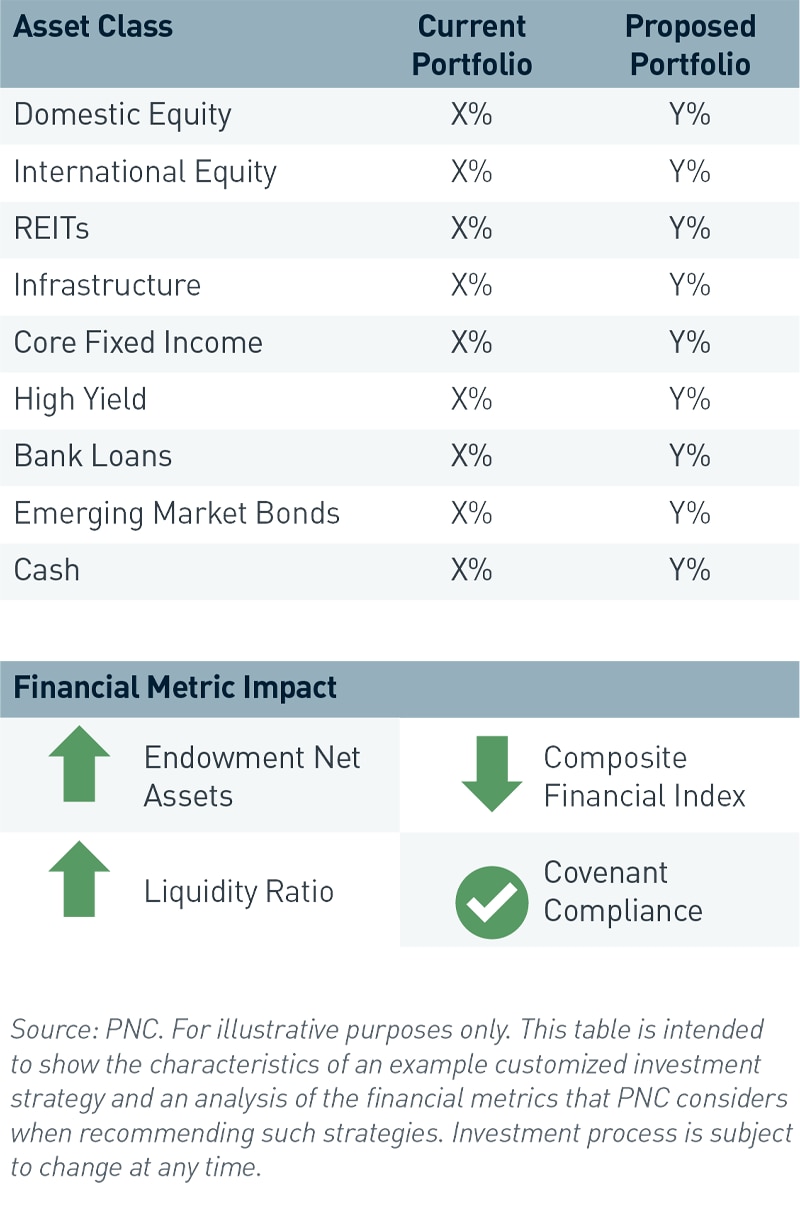
With foundational knowledge of the client and a keen understanding of how investment strategy impacts broader financial health, we tailor a recommendation around improving the probability of achieving targeted financial metric outcomes (Figure 3). For example, an institution may want to understand the degree to which investments can help provide liquidity for a capital spending project, versus utilizing debt financing. Another organization may look to achieve capital growth to bolster its ratio of spendable cash and investments to debt. No matter the goals, we aim to strike the optimal asset allocation that most efficiently balances return needs with the appropriate risk budget.
Figure 3: Targeted Financial Metric Outcomes
View accessible version of this chart.
4. Implementation & oversight
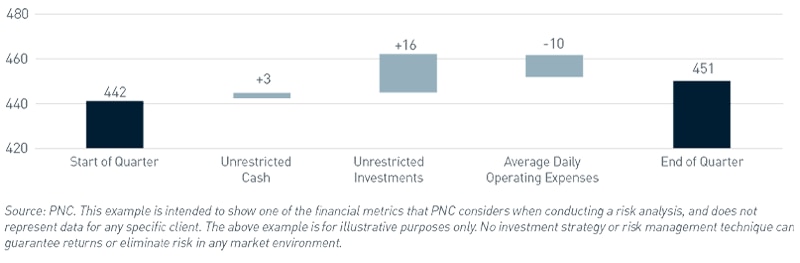
We then implement the customized investment strategy, which entails updating the investment policy statement to reflect clearly defined guidelines and concrete risk parameters. Ongoing monitoring, typically delivered through periodic reporting, is a critical check to help ensure the implemented investment strategy remains appropriate. We track how key financial metrics have changed over time (Figure 4). These measures remain benchmarks for organizational health and are influenced by financial market volatility. Whether a change in goals, operating performance or other material factor occurs, we maintain an ongoing conversation with our clients to ensure the investment strategy stays on track.
Figure 4: Days Cash on Hand
View accessible version of this chart.
By recognizing the intersection of investment reserves and financial health, institutional investors can make more informed decisions and improve outcomes. For more information on how PNC has helped organizations like yours, please reach out to your PNC representative.
1 - CFI is a measure of financial health widely used throughout higher education. It comprises four core ratios that measure different aspects of financial well-being: primary reserve, viability, return on net assets, and net operating revenue ratios.
2 - DOE composite score is a general gauge of an institution’s ability to demonstrate it is maintaining the standards of financial responsibility necessary to participate in Title IV programs (federal student aid).
Accessible Version of Charts
| Sample Timeline of Financial Commitments |
Time T | Observe prudent spending policies |
T + 2 Years | Fund scholarships Spend from quasi-endowment without sacrificing long-term growth |
T + 4 Years | Pay down debt Invest in endowment assets with a perpetual timeline, with time to recover from volatile markets |
T + 7 Years | IT system investment Reduced ability to take risk in funds earmarked for IT investment |
T + N Years | Perpetual wealth |
Figure 2: DOE Composite Score
| Conservative | Current | Balanced | Aggressive |
0-5 | 2.28 | 2.29 | 2.26 | 2.24 |
5-25 | 0.19 | 0.18 | 0.21 | 0.22 |
25-50 | 0.12 | 0.11 | 0.12 | 0.13 |
50-75 | 0.13 | 0.14 | 0.14 | 0.16 |
75-95 | 0.28 | 0.28 | 0.27 | 0.25 |
Median | 2.58 | 2.58 | 2.59 | 2.59 |
Figure 3: Targeted Financial Metric Outcomes
Asset Class | Current Portfolio | Proposed Portfolio |
Domestic Equity | X% | Y% |
International Equity | X% | Y% |
REITs | X% | Y% |
Infrastructure | X% | Y% |
Core Fixed Income | X% | Y% |
High Yield | X% | Y% |
Bank Loans | X% | Y% |
Emerging Market Bonds | X% | Y% |
Cash | X% | Y% |
Figure 4: Days Cash on Hand
Base | Fall | Rise | |
Beginning of Quarter |
| - | 442.39 |
Unrestricted Cash | 442.39 | - | 2.96 |
Unrestricted Investments | 445.35 | - | 16.11 |
Avg. Daily Operating Expenses | 451.09 | 10.38 | - |
End of Quarter | 451.09 |