

Over the past few years, the average funded status of Taft-Hartley pension plans has improved significantly, reaching the highest levels since the 2008 financial crisis. While some of this improvement stems from the Special Financial Assistance Program (SFA) under the American Rescue Plan Act (ARPA), strong equity market performance has also played a role.
With plans in stronger funded positions, as shown in Figure 1, now may be an opportune time to consider “getting off the roller coaster” by de-risking the pension plans. This means shifting toward more stable investment strategies to preserve funded status gains. However, timing this transition can be challenging as de-risking a Taft-Hartley plan is different from the well- established de-risking strategies for a single-employer corporate pension plan. Here, we explore how trustees can capitalize on the current opportunity to implement a strategy that improves long-term sustainability.
Figure 1: Milliman Multiemployer Pension Funding Study
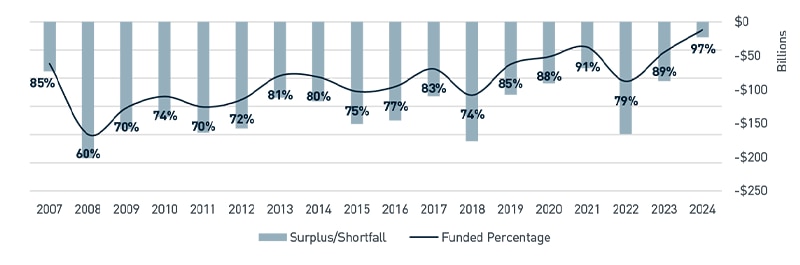
Source: Milliman Multiemployer Pension Funding Study
View accessible version of this chart.
How did we get here?
Traditionally, Taft-Hartley pension plans have followed a “going concern” investment philosophy — targeting long-term returns aligned with the assumed return on assets (used to value liabilities) while managing risk exposure. While this strategy can lead to robust gains in strong markets, the pension roller coaster illustrates that plans are exposed to significant downside risk during market downturns, often making it difficult to recover without external support. The issues were perpetuated as plans became more mature, which increased the occurrence of negative net cashflow where more money is paid out to retirees than is contributed to the plan.
ARPA’s SFA program marked a turning point. Plans receiving assistance are now required to invest the majority of those funds in high-quality, investment- grade fixed income assets. This approach provides more predictable cash flow and improves benefit security for retirees for decades to come. Although only underfunded plans receiving SFA are subject to the requirement, the structure has sparked broader interest among trustees in applying similar strategies across all Taft-Hartley plans, not just those receiving aid.
What can we do?
A key risk management tool is de-risking with a custom liability-driven strategy, in particular one focused on cash flow matching. This approach aligns a portion of the plan assets — specifically investment grade bonds — with the timing and amount of expected retiree payments.Most Taft-Hartley pension plans are mature, with a large share of liabilities attributable to retirees already receiving benefits. These liabilities tend to have shorter maturities/durations and are therefore more efficient to hedge using a cash flow-matched fixed income strategy.
For the sample plan illustrated in Figure 2, the average maturity of the retiree liabilities is half that of the active population. By constructing a diversified portfolio of individual bonds that mature in line with the scheduled benefit payments, the plan makes sure funds are available precisely when needed leading to reduced funded status volatility.
Figure 2: Sample Projected Benefit Payments
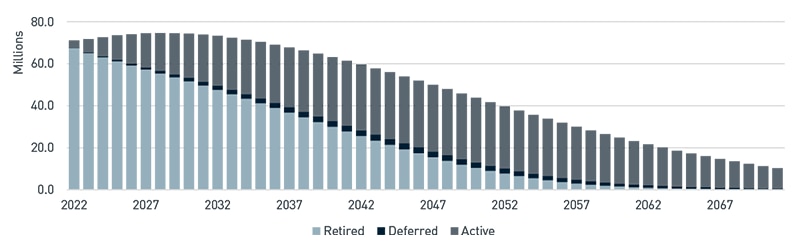
Source: PNC
View accessible version of this chart.
How much de-risking is appropriate?
There is no one-size-fits-all answer. The optimal level of derisking depends on many factors, including fiduciary risk tolerance, plan status, plan maturity, funded status, expected investment return assumptions and expectations for future funding. A prudent first step is to shift the existing fixed income investments to a liability- matching framework. If the fixed income allocation is small relative to the total liability, plans can consider matching a specified portion of future retiree cashflows (e.g., up to 10 years). From there, plans can adopt a glidepath strategy that has a higher allocation to return- seeking (i.e., equity-like) assets at lower-funded levels and gradually shifts toward liability-matching assets as the funded status improves.
A reasonable target when the plan reaches full funding is to allocate enough to cover all retiree liabilities using a liability-matching strategy. For instance, the plan shown in Figure 3 that currently has 31% allocated to fixed income assets would shift the initial 31% to liability-matching strategy, and further move toward 70% liability match, corresponding to the share of liabilities for retirees in pay status as the plan ages. This strategy minimizes shortfall risk in the plan while preserving some exposure to growth assets to cover the longer-term liabilities of active participants.
Figure 3: Sample Asset Allocation Progression
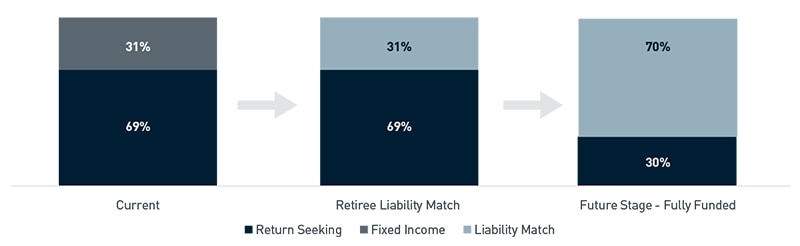
Source: PNC
View accessible version of this chart.
What's next?
De-risking is not just a tactical shift, it’s a strategic evolution toward long-term stability. Before implementing changes, plan trustees should conduct a comprehensive asset liability study to understand the impact on plan metrics, particularly the expected return on assets (which directly affects liability valuations for Taft-Hartley plans. With the recent higher interest rate environment, many plans can de-risk without significantly reducing expected returns. But each plan’s situation is unique, and careful analysis is essential.
Once a de-risking strategy is implemented, reporting requirements should evolve to focus on asset performance relative to liabilities. This shift in focus promotes a comprehensive view of plan health, ultimately providing greater retirement security for participants.
For plan trustees considering how to stabilize the pension, now is the time to evaluate options. A thoughtful de-risking approach could be the key to leaving the pension roller coaster behind — for good.
For more information, contact Kimberlene Matthews, FSA, EA, CFA, Managing Director, Pension & Enterprise Solutions, at PensionEnterpriseSolutions@pnc.com.
Accessible Version of Charts
Figure 1: Milliman Multi-employer Pension Funding Study
| Date | Surplus/(Shortfall) Billions | Funded percentage |
| 12/31/2007 | (73,145,444,266) | 85.2% |
| 3/31/2008 | (98,586,470,138) | 80.1% |
| 6/30/2008 | (110,588,114,506) | 77.8% |
| 9/30/2008 | (139,129,764,874) | 72.3% |
| 12/31/2008 | (201,407,000,338) | 60.1% |
| 3/31/2009 | (238,316,283,929) | 53.2% |
| 6/30/2009 | (199,682,328,181) | 61.0% |
| 9/30/2009 | (164,347,811,002) | 68.1% |
| 12/31/2009 | (158,550,239,200) | 69.5% |
| 3/31/2010 | (150,604,665,992) | 71.2% |
| 6/30/2010 | (178,833,040,490) | 66.0% |
| 9/30/2010 | (158,514,566,709) | 70.1% |
| 12/31/2010 | (140,800,893,572) | 73.5% |
| 3/31/2011 | (133,481,939,036) | 75.1% |
| 6/30/2011 | (137,056,228,482) | 74.5% |
| 9/30/2011 | (183,377,109,995) | 66.0% |
| 12/31/2011 | (164,075,700,523) | 69.8% |
| 3/31/2012 | (145,037,429,174) | 73.5% |
| 6/30/2012 | (156,095,103,384) | 71.6% |
| 9/30/2012 | (148,084,424,379) | 73.7% |
| 12/31/2012 | (157,550,377,473) | 72.4% |
| 3/31/2013 | (138,276,387,788) | 76.0% |
| 6/30/2013 | (142,313,870,637) | 75.4% |
| 9/30/2013 | (131,649,996,652) | 77.4% |
| 12/31/2013 | (111,980,014,549) | 80.9% |
| 3/31/2014 | (119,314,676,938) | 79.7% |
| 6/30/2014 | (108,104,883,802) | 81.7% |
| 9/30/2014 | (120,263,201,440) | 79.8% |
| 12/31/2014 | (117,199,750,866) | 80.4% |
| 3/31/2015 | (115,457,348,347) | 80.8% |
| 6/30/2015 | (124,693,623,104) | 79.4% |
| 9/30/2015 | (159,140,103,487) | 73.9% |
| 12/31/2015 | (150,929,169,709) | 75.3% |
| 3/31/2016 | (152,211,732,400) | 75.4% |
| 6/30/2016 | (150,404,118,772) | 75.8% |
| 9/30/2016 | (141,865,432,296) | 77.5% |
| 12/31/2016 | (145,715,187,428) | 77.0% |
| 3/31/2017 | (133,769,112,496) | 79.1% |
| 6/30/2017 | (125,277,879,416) | 80.5% |
| 9/30/2017 | (124,233,866,251) | 81.1% |
| 12/31/2017 | (110,022,325,643) | 83.3% |
| 3/31/2018 | (123,898,675,774) | 81.3% |
| 6/30/2018 | (124,638,619,623) | 81.3% |
| 9/30/2018 | (123,504,054,969) | 81.7% |
| 12/31/2018 | (176,166,449,702) | 74.0% |
| 3/31/2019 | (137,223,191,935) | 79.9% |
| 6/30/2019 | (123,772,128,613) | 82.0% |
| 9/30/2019 | (134,827,894,614) | 81.0% |
| 12/31/2019 | (107,488,292,000) | 84.9% |
| 3/31/2020 | (200,104,496,199) | 72.1% |
| 6/30/2020 | (133,413,057,187) | 81.5% |
| 9/30/2020 | (128,874,270,914) | 82.3% |
| 12/31/2020 | (90,771,039,174) | 87.6% |
| 3/31/2021 | (80,886,710,400) | 89.0% |
| 6/30/2021 | (59,822,133,615) | 91.9% |
| 9/30/2021 | (80,793,354,502) | 89.3% |
| 12/31/2021 | (68,542,657,707) | 91.0% |
| 3/31/2022 | (91,996,862,229) | 88.0% |
| 6/30/2022 | (154,201,046,623) | 80.0% |
| 9/30/2022 | (188,021,974,894) | 75.9% |
| 12/31/2022 | (165,577,524,056) | 78.9% |
| 3/31/2023 | (110,454,695,973) | 86.1% |
| 6/30/2023 | (101,615,670,766) | 87.2% |
| 9/30/2023 | (121,422,183,790) | 84.9% |
| 12/31/2023 | (87,364,818,855) | 89.2% |
| 3/31/2024 | (59,073,573,316) | 92.7% |
| 6/30/2024 | (57,659,080,484) | 92.9% |
| 9/30/2024 | (12,503,339,865) | 98.5% |
| 12/31/2024 | (22,725,438,614) | 97.2% |
Figure 2: Sample Projected Benefit Payments
| Active | Deferred | Retired | Total | |
| 2022 | 3,418,162 | 209,307 | 67,503,885 | 71,131,353 |
| 2023 | 6,429,602 | 341,154 | 65,056,894 | 71,827,650 |
| 2024 | 9,051,574 | 514,849 | 63,065,843 | 72,632,266 |
| 2025 | 11,646,765 | 704,699 | 61,146,943 | 73,498,407 |
| 2026 | 14,032,968 | 860,608 | 59,188,089 | 74,081,664 |
| 2027 | 16,155,435 | 1,058,261 | 57,283,860 | 74,497,555 |
| 2028 | 17,977,433 | 1,226,410 | 55,418,860 | 74,622,704 |
| 2029 | 19,538,556 | 1,402,945 | 53,552,649 | 74,494,150 |
| 2030 | 21,212,030 | 1,583,697 | 51,620,372 | 74,416,099 |
| 2031 | 22,531,935 | 1,766,722 | 49,635,485 | 73,934,142 |
| 2032 | 23,704,044 | 1,970,279 | 47,597,248 | 73,271,571 |
| 2033 | 24,740,725 | 2,119,702 | 45,502,533 | 72,362,960 |
| 2034 | 25,815,732 | 2,248,990 | 43,360,038 | 71,424,760 |
| 2035 | 26,803,233 | 2,346,208 | 41,178,786 | 70,328,228 |
| 2036 | 27,662,146 | 2,458,385 | 38,967,961 | 69,088,493 |
| 2037 | 28,460,220 | 2,548,754 | 36,736,733 | 67,745,707 |
| 2038 | 29,209,961 | 2,612,066 | 34,494,399 | 66,316,426 |
| 2039 | 29,856,044 | 2,665,611 | 32,250,573 | 64,772,227 |
| 2040 | 30,402,636 | 2,717,729 | 30,015,145 | 63,135,510 |
| 2041 | 30,836,345 | 2,746,820 | 27,798,297 | 61,381,462 |
| 2042 | 31,223,854 | 2,784,540 | 25,610,448 | 59,618,841 |
| 2043 | 31,527,484 | 2,797,096 | 23,462,269 | 57,786,849 |
| 2044 | 31,746,072 | 2,813,090 | 21,364,686 | 55,923,848 |
| 2045 | 31,842,493 | 2,807,037 | 19,328,751 | 53,978,280 |
| 2046 | 31,839,255 | 2,807,039 | 17,365,554 | 52,011,849 |
| 2047 | 31,722,754 | 2,768,706 | 15,486,069 | 49,977,528 |
| 2048 | 31,525,881 | 2,702,191 | 13,700,944 | 47,929,016 |
| 2049 | 31,213,782 | 2,630,778 | 12,020,272 | 45,864,833 |
| 2050 | 30,784,691 | 2,553,638 | 10,453,063 | 43,791,392 |
| 2051 | 30,253,165 | 2,465,988 | 9,006,850 | 41,726,003 |
| 2052 | 29,640,102 | 2,385,938 | 7,687,226 | 39,713,265 |
| 2053 | 28,898,175 | 2,289,308 | 6,497,456 | 37,684,938 |
| 2054 | 28,081,939 | 2,180,760 | 5,438,229 | 35,700,927 |
| 2055 | 27,197,735 | 2,066,037 | 4,507,482 | 33,771,255 |
| 2056 | 26,220,256 | 1,949,403 | 3,700,524 | 31,870,182 |
| 2057 | 25,166,955 | 1,824,222 | 3,010,279 | 30,001,457 |
| 2058 | 24,082,566 | 1,701,570 | 2,427,790 | 28,211,926 |
| 2059 | 22,953,947 | 1,577,146 | 1,942,774 | 26,473,867 |
| 2060 | 21,789,302 | 1,457,823 | 1,544,180 | 24,791,304 |
| 2061 | 20,608,820 | 1,339,828 | 1,220,762 | 23,169,410 |
| 2062 | 19,408,431 | 1,225,759 | 961,529 | 21,595,718 |
| 2063 | 18,210,145 | 1,116,614 | 756,104 | 20,082,864 |
| 2064 | 17,024,370 | 1,013,160 | 594,991 | 18,632,521 |
| 2065 | 15,864,945 | 915,619 | 469,732 | 17,250,296 |
| 2066 | 14,731,455 | 824,241 | 372,996 | 15,928,691 |
| 2067 | 13,635,270 | 739,011 | 298,582 | 14,672,863 |
| 2068 | 12,581,116 | 659,865 | 241,386 | 13,482,367 |
| 2069 | 11,572,174 | 586,669 | 197,309 | 12,356,152 |
| 2070 | 10,610,540 | 519,245 | 163,131 | 11,292,916 |
| 2071 | 9,697,016 | 457,399 | 136,377 | 10,290,792 |
Source: PNC
Figure 3: Sample Asset Allocation Progression
| Current | Retiree Liability Match | Future Stage – Fully Funded |
Return Seeking | 69% | 69% | 30% |
Fixed Income | 31% | 0 | 0 |
Liability Match | 0 | 31% | 70% |
Source: PNC