
A global pandemic, a rapid rise in market volatility, a renewed push for social reform, and other events have acted as catalysts for change in the United States this year. Nonprofit organizations now find themselves stretched thin as they support their communities, colleges and universities face financial uncertainty from shutting down campuses, and healthcare systems are hit with declining revenue from postponing elective medical procedures.
As a result, nonprofit organizations have been forced to think strategically about their financial assets as they work to raise and maintain the funding necessary to achieve their mission objectives. Should they:
- Make special distributions from endowed or other long-term asset pools,
- Borrow from existing lines of credit,
- Participate in government relief programs, or
- Some combination of the above?
In this paper, we focus on the challenges for nonprofit organizations when choosing to make special distributions from longer-term asset pools.
Understanding the Role of Assets in Mission Objectives
Before discussing how a nonprofit raises money, it is important to understand the life cycle of a dollar in a nonprofit. With this knowledge, an organization can map out the cost of capital and its expected return – key aspects in choosing the most prudent option for utilizing capital.
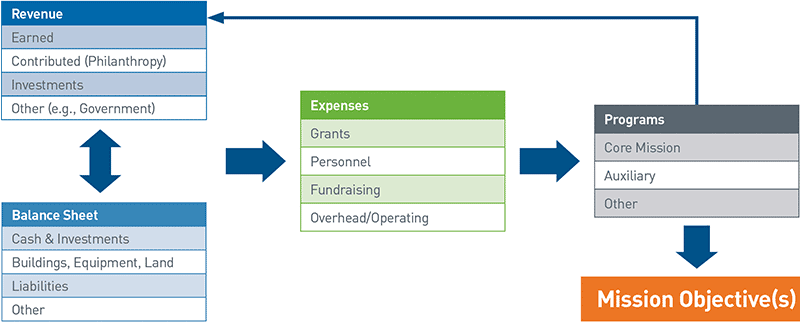
In Figure 1, we outline how the cost of capital works. We start with how financial assets are sourced and end with how they are used in meeting mission objectives (their “return”).
The Journey for Financial Assets
View accessible version of this chart.
Source: PNC
There are two sources of financial assets:
- Revenue, which encompasses everything from fundraising to fees for service and government grants; and
- The organization’s balance sheet, which comprises assets (investments, cash, buildings), liabilities (debt, credit lines, etc.), and shareholder equity.
While the methods might differ, these two areas have the ability to generate cash flow for a nonprofit organization.
Dollars generated from revenue or the balance sheet must first go toward covering expenses, including, but not limited to, personnel, overhead/operating costs, grant-making fees, and costs associated with fundraising. Any remaining funds may be available, illustrated in the “programs” category above, to be put toward achieving the organization’s mission objectives.
The programs component of the journey is intended to achieve mission objectives for operating organizations. This could range from running a food pantry to building a new science building on a college campus, to providing free or discounted clinical services to low-income community members. For a nonoperating organization (e.g., a private foundation), this might include making grants for scholarships or contributing to operating nonprofits that align with the organization’s mission.
In Figure 1, note the arrow leading from programs back to revenue. Successful programs, especially ones that make tangible progress toward mission objectives, could help organizations appeal successfully to donors, grantors, and other revenue sources, thus serving as an additional source of revenue. We view transparency regarding progress toward objectives and a track record of success as two of the most effective tools in a nonprofit’s toolkit.
Understanding the Cost of a Dollar
One of the most important concepts in finance is the cost of capital, which simply put, refers to how much it costs to have money available to an organization. Part of this cost can be measured in a tangible way (e.g., if the money is borrowed as debt, the “cost” would be the rate of interest on the debt) or less tangible way. For instance, staying with the example of debt, there can be factors, such as the potential for financial distress associated with owing money (and needing the ongoing cash flow to support debt payments), that are harder to measure.
There is a cost to the dollar, whether associated with fundraising, interest owed on debt borrowed, or even lost investment return potential of the dollar had it remained invested (i.e., as part of an endowed asset pool). The chart below illustrates a hypothetical example of this analysis. Using a combination of historical endowment returns and recent borrowing costs shows how a nonprofit organization could compare the earning potential of a dollar in an endowment to another source of funds, such as borrowing money through a debt instrument.
Comparing Costs of Capital: Endowment Distribution (1) versus Debt Instruments (2)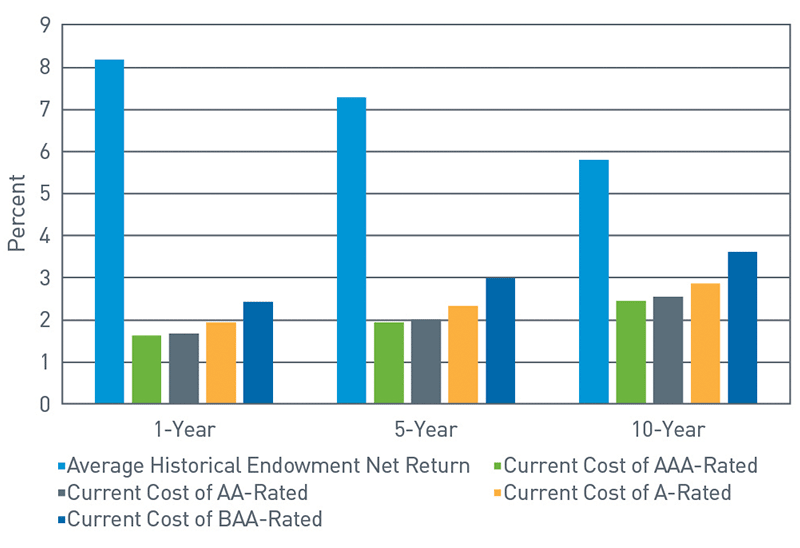
Source: 1) NACUBO-TIAA 2019 Study of Endowments, as of 6/30/18; 2) Thomson Reuters Municipal Market Monitor, as of 1/16/20
View accessible version of this chart.
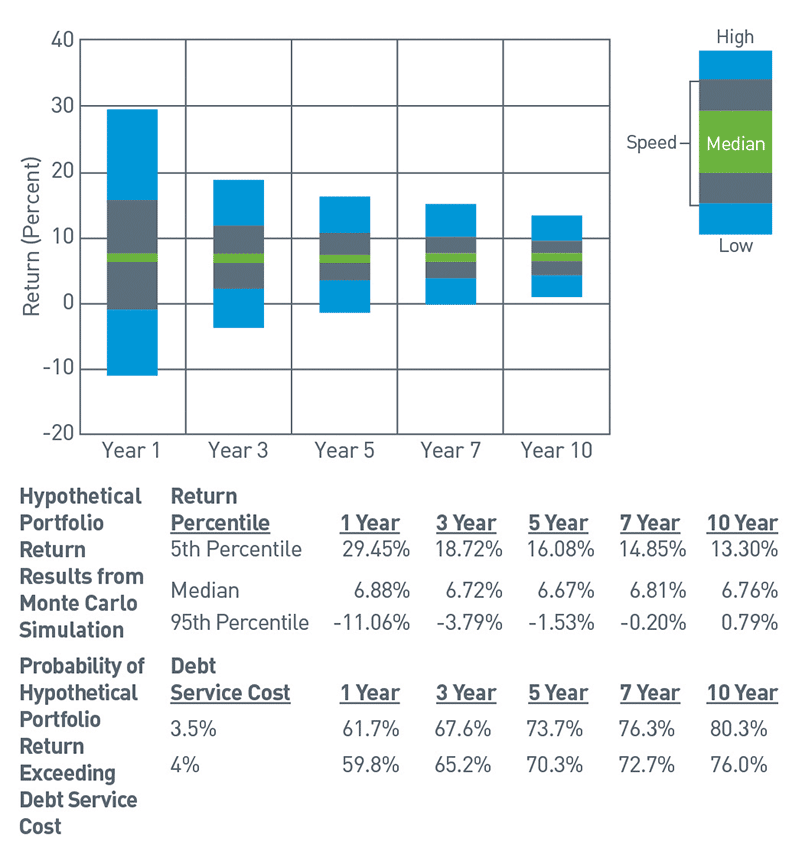
The analysis is not quite this simple in practice, of course. Time horizon, future return expectations, and other financial objectives and constraints are relevant in the decision-making process and may result in a range of different outcomes (i.e., the cost of capital could be higher or lower than forecast). Specifically, past performance is not always indicative of future returns, meaning the endowment performance might not always be higher than the cost of debt. Before making a decision based on potential investment returns, we recommend conducting a forward-looking analysis using a modeling tool like a Monte Carlo simulation, such as the hypothetical one illustrated in the chart below. While the analysis below is for illustrative purposes only, the framework is one example of how nonprofit organizations can evaluate various sources of capital.
Monte Carlo simulations involve the calculation and statistical description of the outcomes resulting from a particular asset allocation under random scenarios for investment returns, inflation, and other relevant variables.
Range of Returns for Hypothetical Long-Term Investment Portfolio
Source: MSCI Risk Metrics, PNC
View accessible version of this chart.
This chart is for illustrative purposes only and should not be relied upon for any reason. Actual account results may vary significantly.
The Endowment as an Emergency Funding Mechanism
As we mentioned earlier, nonprofit organizations, higher education institutions, and healthcare systems are being forced to think strategically about how they will survive extreme financial turmoil associated with a number of challenges.
In response, specifically around budget and revenue shortfalls, organizations are facing situations ranging from the less extreme (i.e., making up for temporary cash flow shortfalls) to the more extreme (i.e., trying to keep the lights on). As a result, many nonprofit organizations have considered strategies that generally focus on creating and preserving cash on the balance sheet by raising capital and/or minimizing expenses, such as salary cuts, furloughs, suspending retirement plan contribution matching, drawing on credit lines, or issuing new debt.
For most nonprofit institutions, the endowment and other longer-term asset pools provide a set distribution that is based on a spending policy or minimum required distribution. For example, a large number of nonprofit organizations follow a spending policy of making an annual distribution of a set percentage (e.g., 4%) of a rolling 12-quarter average of their portfolio’s market value. For most longer-term investment pools, this spending policy is incorporated into the investment policy decision (specifically, the return objectives) to maintain the purchasing power of the pool. That is, the investment program is typically designed to target a return greater than the cost of the distribution, inflation, and related overhead costs. If successful, this strategy helps increase the probability that the longer-term asset pools are able to support the institution into perpetuity.
With that said, some nonprofit organizations may want, or need, to make special, permanent distributions from their endowments to solve budget or revenue shortfalls without creating more debt or cutting expenses. The idea is that the money is available to them at their discretion (barring potential restrictions we outline in the next section), making it easier to access capital at a time when organizations are finding themselves in situations where they really need it. Specifically, funds in an existing endowment may be easier to access (i.e., than debt markets or government relief programs) and potentially less contentious (i.e., than compensation cuts) compared to alternative funding sources or expense reduction strategies.
What Are Potential Long-Term Costs of a Special Distribution?
In the hypothetical scenario in the chart below, we plot the effect that a special distribution of $10 million (roughly 10-15% of the portfolio’s value at the time of the distribution) during the global financial crisis of 2008 would have had on a hypothetical endowment portfolio.1 In this basic example, the effects of the distribution over 10 years include:
- The ending value for the portfolio that made the special distribution was $23.75 million lower than the portfolio that did not make a special distribution. This represents a roughly -17% difference in ending value.
- Total distributions over this 10-year period, excluding the special distribution, were roughly $7.5 million lower for the portfolio that took the special distribution.
- At the end of the hypothetical scenario, the portfolio that took the special distribution was making a normal annual distribution (4% of market value) that was almost $1 million lower than the portfolio that did not make a special distribution.
Hypothetical Scenario: Charting the 10-Year Impact of a Special Distribution
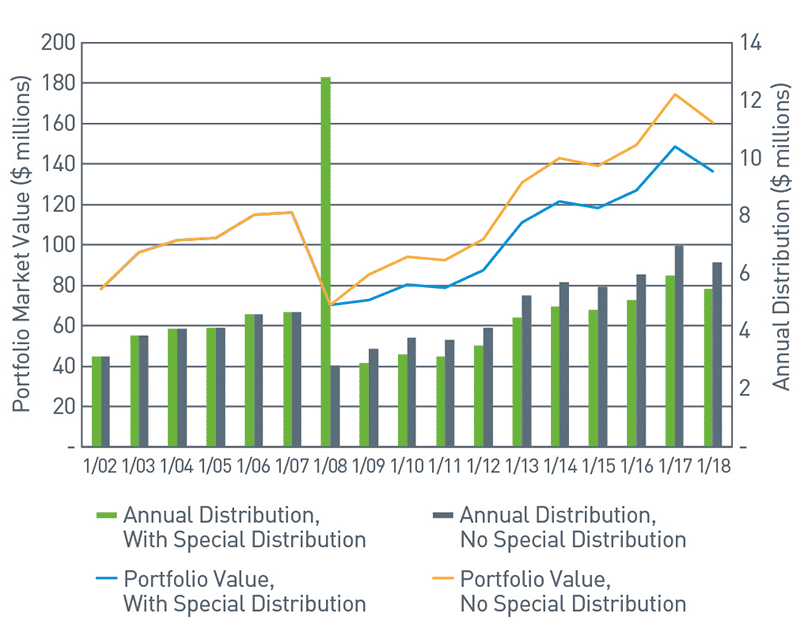
Source: FactSet Research Systems Inc., PNC
View accessible version of this chart.
While the analysis in this hypothetical scenario is only theoretical and subject to the limitations of our assumptions, a special distribution could have profound consequences on the portfolio’s value over time and its ability to make ongoing contributions to support an organization.
Barring outside contributions that help to recover the loss of principal from the special distribution, making a special distribution could impact the ongoing ability of a long-term asset pool (the endowment in this example) to support the organization that owns it.
Five Things to Consider before Making a Special Distribution
Following are five points to consider before deciding to make a special distribution. For some organizations, taking a special distribution from a long-term asset pool might not be the best option available; conversely, for other organizations, taking a special distribution from a long-term asset pool might be the only option. Somewhere in between, a special distribution might be the most financially attractive source of capital for a given nonprofit organization. Regardless of where an organization falls on this spectrum, we believe there are some common elements that may help to frame the analysis.
1. Are there any donor or organizational policy restrictions that might prevent the special distribution from being used for its intended purpose?
Before making any other decisions, it is important to determine if a longer-term asset pool can make a special distribution. Further, an organization would need to determine if the distribution can be made for the intended use. As an example of an impediment, some donors place restrictions on funds they donate, ranging from “this donation can only be used to support athletic programs” to “these funds can only be used to support scholarships to students from low-income families.” Funds with restrictions might not be available to use as a special distribution to fund a general operating account, make debt service payments, or fulfill payroll obligations. Determining what restrictions exist on the use of longer-term asset pools is an important first step when considering a special distribution.
2. Are there any legal or regulatory considerations, such as certain provisions of the Uniform Prudent Management of Institutional Funds Act (UPMIFA), that could prevent a special distribution?
There are a number of legal and regulatory policies that might affect a given nonprofit organization’s ability to make special distributions from its longer-term asset pools. These might range from local or state laws that apply to a public university to certain regulatory policies, such as UPMIFA, that place restrictions (differing from state to state) on nonprofit organizations. A nonprofit may want to consult an attorney experienced in working with nonprofit organizations to make sure a special distribution is possible.
3. What alternatives are worth considering as part of the analysis?
As we previously mentioned, the endowment is not the only source of funding generally available to nonprofit organizations. Debt instruments and strategies such as drawing on a line of credit or engaging in a bond issuance are also approaches used by nonprofit and for-profit organizations alike. Depending on the type of organization, federal or state government relief programs could also serve as a source of emergency funding. Look at the full range of options available to your organization and consider the pros and cons of each, such as cost, restrictions that the source of funding might put on your organization (such as debt covenants), and timing of funding availability.
4. Can the long-term asset pool(s) support a special distribution?
Market volatility in 2020 has caused drawdowns in investment portfolios. Additionally, as return expectations for traditional asset classes have fallen over the last decade, many nonprofit organizations have pushed into higher volatility and illiquid investment strategies to meet return objectives. This, in turn, can create liquidity issues for organizations looking to take special distributions from their endowments. As an example of where this could become an issue, an investment portfolio’s liquid assets (those able to be sold and converted to cash quickly) might currently be trading below their fair market value. To liquidate the investments now might entail missing out on the equity market recovery and/or potentially selling the assets at a loss.
5. Is the distribution a “grant” or is it meant to be repaid?
If an endowment has $100 in principal and distributes 5% of it a year sustainably (meaning the investments earn enough to fund the distribution and cover inflation/overhead costs), that endowment is able to contribute $5 a year in distributions. If, in this scenario, the nonprofit organization makes an emergency distribution of $20, that endowment only has $80 in remaining principal upon which to draw 5%, meaning the annual distribution becomes $4. If the principal value is $100 million, the original distribution is $5 million, and, as a result of the special distribution, the distribution becomes $4 million. But the pain doesn’t stop with year one: Unless the principal recovers to its original level, it is a $1 million per year distribution decrease year after year. As an example, over 10 years, $10 million will no longer be available to the budget. How would your organization handle a $1 million decrease in annual budget funding? With this in mind, it is important to consider if the distribution would be a grant, meaning a permanent distribution, with no intention of repayment, or if the organization would structure it as “internal debt,” with the intention of repayment. For example, an institution could borrow the money (assuming it is legally allowed by policies governing the funds) from a longer-term pool, like its endowment, at a reasonable rate of interest with a repayment schedule that allows for the organization’s revenue and finances to recover from the crisis.
Balancing Solvency and Financial Viability in the Future
Through all of the challenges facing nonprofit organizations this year, they will need to continue implementing tactical plans to manage their finances. To help weather this storm and prepare for whatever comes next, organizations will need to find ways to balance maintaining solvency in the present with being financially viable in the future. It might not be an easy road, but the good work nonprofit organizations do for communities and society at large makes it worth it.
For more information or for more on how PNC can help, please reach out to your PNC Representative.
About The Endowment & Foundation National Practice Group
The Endowment & Foundation National Practice Group builds on PNC Bank’s long-standing commitment to philanthropy and is focused on endowments, private and public foundations, and nonprofit organizations. Our group is structured to help these organizations address their distinct investment, distribution and capital preservation challenges.
For more information, please contact Chris McGurn at christopher.mcgurn@pnc.com or Henri Cancio-Fitzgerald at henri.fitzgerald@pnc.com.
Accessible Version of Charts
Figure 1: The Journey for Financial Assets
Two sources of financial assets and their components:
- Revenue
- Earned
- Contributed (Philanthropy)
- Investments
- Other (e.g., Government)
- Balance Sheet
- Cash & Investments
- Buildings, Equipment, Land
- Liabilities
- Other
Dollar from Revenue and the Balance Sheet first go toward Expenses:
- Grants
- Personnel
- Fundraising
- Overhead/Operating
Then to Programs:
- Core Mission
- Auxiliary
- Other
Programs component is intended to achieve an organization’s mission objectives.
The arrow leading from programs back to revenue illustrates that successful programs could help organizations appeal successfully to donors, grantors, and other revenue sources, thus serving as an additional source of revenue.
Chart 1: Comparing Costs of Capital: Endowment Distribution[1] versus Debt Instruments[2]
| Average Historical Endowment Net Return | Current Cost of AAA-Rated | Current Cost of AA-Rated | Current Cost of A-Rated | Current Cost of BAA-Rated | |
| 1-Year | 8.20% | 1.63% | 1.68% | 1.94% | 2.43% |
| 5-Year | 7.30% | 1.94% | 2.02% | 2.33% | 2.98% |
| 10-Year | 5.80% | 2.45% | 2.54% | 2.87% | 3.61% |
Chart 2: Range of Returns for Hypothetical Long-Term Investment Portfolio[1]
Hypothetical Portfolio Return Results from Monte Carlo Simulation
| Return Percentile | 1 Year | 3 Year | 5 Year | 7 Year | 10 Year |
| 5th Percentile | 29.45% | 18.72% | 16.08% | 14.85% | 13.30% |
| Median | 6.88% | 6.72% | 6.67% | 6.81% | 6.76% |
| 95th Percentile | -11.06% | -3.79% | -1.53% | -0.20% | 0.79% |
Probability of Hypothetical Portfolio Return Exceeding Debt Service Cost
| Debt Service Cost | 1 Year | 3 Year | 5 Year | 7 Year | 10 Year |
| 3.50% | 61.70% | 67.60% | 73.70% | 76.30% | 80.30% |
| 4% | 59.80% | 65.20% | 70.30% | 72.70% | 76.00% |
Chart 3: Hypothetical Scenario: Charting the 10-Year Impact of a Special Distribution
| Portfolio with no Special Distribution | ||||
| S&P 500 Annual Return | Portfolio Beginning Value | Portfolio Ending Value | 4% Distribution | |
| 31-Dec-2002 | -22.1 | 100 | 77.9 | 3.12 |
| 31-Dec-2003 | 28.68 | 74.78 | 96.23 | 3.85 |
| 31-Dec-2004 | 10.88 | 92.38 | 102.44 | 4.1 |
| 31-Dec-2005 | 4.91 | 98.34 | 103.17 | 4.13 |
| 31-Dec-2006 | 15.8 | 99.04 | 114.69 | 4.59 |
| 31-Dec-2007 | 5.49 | 110.1 | 116.15 | 4.65 |
| 31-Dec-2008 | -37 | 111.5 | 70.25 | 2.81 |
| 31-Dec-2009 | 26.46 | 67.44 | 85.29 | 3.41 |
| 31-Dec-2010 | 15.06 | 81.88 | 94.21 | 3.77 |
| 31-Dec-2011 | 2.11 | 90.44 | 92.35 | 3.69 |
| 31-Dec-2012 | 16 | 88.66 | 102.84 | 4.11 |
| 31-Dec-2013 | 32.39 | 98.73 | 130.71 | 5.23 |
| 31-Dec-2014 | 13.69 | 125.48 | 142.66 | 5.71 |
| 31-Dec-2015 | 1.38 | 136.95 | 138.84 | 5.55 |
| 31-Dec-2016 | 11.9601 | 133.29 | 149.23 | 5.97 |
| 31-Dec-2017 | 21.83159 | 143.26 | 174.54 | 6.98 |
| 31-Dec-2018 | -4.3843 | 167.56 | 160.21206 | 6.41 |