Last month, we provided a guide to several of the most important economic statistics, focusing on what the data measures, why it matters, and how to interpret it in the current environment. Specifically, we highlighted two key indicators for the labor market (nonfarm payrolls and the unemployment rate), two measures of inflation (core personal consumption expenditures or PCE and the core Consumer Price Index or core CPI), and two gauges of economic activity (real GDP and consumer spending).
This month, we take a deeper dive into several lesser known reports that complement those headline indicators and can provide additional perspective on the current and future state of the economy. Economic data can be noisy and, at times, contradictory. However, maintaining a consistent focus on a broader set of indicators can help investors cut through that noise and better assess where the economy may be headed.
Labor market
Last month, we highlighted nonfarm payroll growth as one of the most important and timely measures of economic momentum. While payrolls show the net number of jobs added each month, the Job Openings and Labor Turnover Survey (JOLTS) provides a much more detailed view of labor market conditions.
JOLTS tracks job openings, hires, layoffs and voluntary quits. Together, these measures provide a clearer picture of the flows of workers into and out of employment that ultimately drive payroll growth.
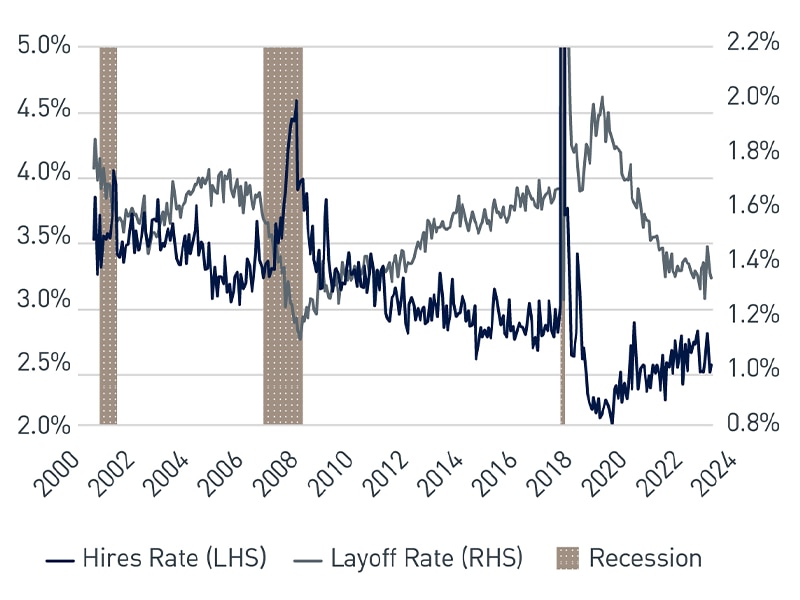
JOLTS is particularly useful because it allows us to decompose net job growth into its underlying components. The current labor market is somewhat unusual in that overall labor market "churn" remains relatively low. Hiring activity has slowed considerably from the exceptionally strong pace seen immediately after the pandemic, but layoffs have remained limited as well. As a result, the labor market has settled into what many have described as a "low-hire, low-fire" environment.
JOLTS Hiring Rate vs. Layoff Rate
View accessible version of this chart.
While JOLTS is released monthly, initial unemployment insurance claims are published weekly, making them one of the timeliest labor market indicators available. Initial claims measure the number of people filing for unemployment benefits for the first time after losing a job. Although weekly readings can be volatile, sustained increases in claims have historically been associated with slower economic growth and rising unemployment, making them one of the earliest warning signs of labor market weakness.
Inflation
Last month, we highlighted core PCE and core CPI as the two primary measures of inflation that investors should monitor when assessing underlying price pressures. However, no inflation measure is perfect, and both the Federal Reserve (Fed) and financial markets rely on a broader set of indicators to help separate signal from noise. Two important examples are trimmed mean PCE and "supercore" inflation, which is generally defined as core services inflation excluding housing.
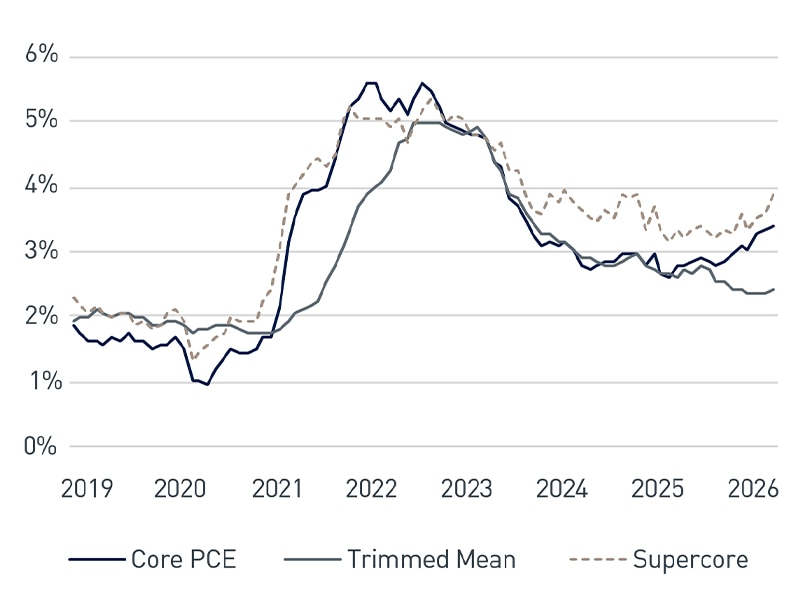
Trimmed mean PCE has received increased attention recently because Fed Chair Kevin Warsh has described it as his preferred measure of inflation. Rather than excluding entire categories such as food and energy, trimmed mean PCE removes the most extreme price increases and decreases each month, regardless of category. By filtering out unusually volatile price movements, it aims to provide a clearer view of the underlying inflation trend and can often offer a more stable signal than traditional inflation measures.
Another measure that has gained prominence in recent years is supercore inflation. The measure focuses on labor-intensive service industries, such as healthcare, recreation, and personal services, where price pressures tend to be closely linked to wage growth. As a result, supercore inflation can provide insight into whether underlying inflation pressures are becoming entrenched, even after goods and housing inflation have cooled.
Core PCE vs. Trimmed Mean vs. Supercore Inflation
View accessible version of this chart.
Economic activity
Economic activity ultimately reflects the decisions made by businesses and consumers. Two reports provide useful insight into those decisions.
The Institute for Supply Management® (ISM®) Manufacturing Purchasing Managers' Index (PMI®) is one of the most closely watched business surveys in the United States. Each month, purchasing managers are asked whether conditions such as production, new orders, employment and inventories are improving or deteriorating. Readings above 50 indicate expansion, while readings below 50 signal contraction. Because business sentiment often changes before hard economic data, the ISM survey can provide an early indication of shifts in economic momentum.
Retail sales provide a timely snapshot of consumer spending, which accounts for roughly two-thirds of economic activity. Released monthly by the U.S. Census Bureau, the report offers one of the earliest indications of changes in household demand. Strong retail sales growth generally signals resilient consumers and continued expansion, while weaker readings can point to slowing demand and softer economic growth ahead.
Putting it together
No single report can fully capture the state of the economy. But by looking beyond the headline indicators, investors can gain a deeper understanding of the forces shaping future economic conditions.
As always, we stress the importance of staying invested and maintaining a well-diversified portfolio to meet your longterm financial goals. Your PNC Private Bank advisor can help you tune out the noise and focus on your priorities.
Accessible Version of Charts
JOLTS Hiring Rate vs. Layoff Rate
| Date | NBER Recession Indicator | Hires Rate (LHS) | Layoff Rate (RHS) |
| 2000-12-01 | 0 | 4.0884% | 1.5205% |
| 2001-01-01 | 0 | 4.3119% | 1.6729% |
| 2001-02-01 | 0 | 3.9936% | 1.3970% |
| 2001-03-01 | 0 | 4.1642% | 1.6068% |
| 2001-04-01 | 1 | 3.9288% | 1.4216% |
| 2001-05-01 | 1 | 4.0859% | 1.5324% |
| 2001-06-01 | 1 | 3.8617% | 1.5231% |
| 2001-07-01 | 1 | 3.9676% | 1.5419% |
| 2001-08-01 | 1 | 3.9562% | 1.5232% |
| 2001-09-01 | 1 | 3.7598% | 1.5991% |
| 2001-10-01 | 1 | 3.8630% | 1.7641% |
| 2001-11-01 | 1 | 3.7470% | 1.7195% |
| 2001-12-01 | 0 | 3.6867% | 1.4674% |
| 2002-01-01 | 0 | 3.7101% | 1.4573% |
| 2002-02-01 | 0 | 3.6723% | 1.5130% |
| 2002-03-01 | 0 | 3.6000% | 1.4405% |
| 2002-04-01 | 0 | 3.7729% | 1.4975% |
| 2002-05-01 | 0 | 3.7181% | 1.5058% |
| 2002-06-01 | 0 | 3.7261% | 1.5420% |
| 2002-07-01 | 0 | 3.7876% | 1.6097% |
| 2002-08-01 | 0 | 3.7303% | 1.4726% |
| 2002-09-01 | 0 | 3.7386% | 1.5494% |
| 2002-10-01 | 0 | 3.6733% | 1.4814% |
| 2002-11-01 | 0 | 3.6688% | 1.4883% |
| 2002-12-01 | 0 | 3.7504% | 1.5383% |
| 2003-01-01 | 0 | 3.8737% | 1.6152% |
| 2003-02-01 | 0 | 3.6139% | 1.5448% |
| 2003-03-01 | 0 | 3.4323% | 1.4965% |
| 2003-04-01 | 0 | 3.5338% | 1.5349% |
| 2003-05-01 | 0 | 3.5930% | 1.5914% |
| 2003-06-01 | 0 | 3.5964% | 1.5946% |
| 2003-07-01 | 0 | 3.5634% | 1.5839% |
| 2003-08-01 | 0 | 3.5850% | 1.6611% |
| 2003-09-01 | 0 | 3.6844% | 1.4833% |
| 2003-10-01 | 0 | 3.7581% | 1.5095% |
| 2003-11-01 | 0 | 3.6534% | 1.4952% |
| 2003-12-01 | 0 | 3.8166% | 1.5369% |
| 2004-01-01 | 0 | 3.7474% | 1.5579% |
| 2004-02-01 | 0 | 3.6600% | 1.5173% |
| 2004-03-01 | 0 | 3.9858% | 1.5747% |
| 2004-04-01 | 0 | 3.9205% | 1.5295% |
| 2004-05-01 | 0 | 3.7784% | 1.4533% |
| 2004-06-01 | 0 | 3.8006% | 1.4318% |
| 2004-07-01 | 0 | 3.7094% | 1.4296% |
| 2004-08-01 | 0 | 3.7995% | 1.4961% |
| 2004-09-01 | 0 | 3.8323% | 1.5346% |
| 2004-10-01 | 0 | 3.8881% | 1.4370% |
| 2004-11-01 | 0 | 3.9101% | 1.5373% |
| 2004-12-01 | 0 | 3.8852% | 1.4710% |
| 2005-01-01 | 0 | 3.9170% | 1.5123% |
| 2005-02-01 | 0 | 3.9659% | 1.5545% |
| 2005-03-01 | 0 | 3.9601% | 1.6432% |
| 2005-04-01 | 0 | 4.0159% | 1.4657% |
| 2005-05-01 | 0 | 3.9427% | 1.5117% |
| 2005-06-01 | 0 | 4.0135% | 1.5043% |
| 2005-07-01 | 0 | 3.9672% | 1.4133% |
| 2005-08-01 | 0 | 4.0215% | 1.4163% |
| 2005-09-01 | 0 | 4.0824% | 1.5102% |
| 2005-10-01 | 0 | 3.8057% | 1.3911% |
| 2005-11-01 | 0 | 3.9586% | 1.3104% |
| 2005-12-01 | 0 | 3.9169% | 1.4228% |
| 2006-01-01 | 0 | 3.8921% | 1.3173% |
| 2006-02-01 | 0 | 4.0329% | 1.3865% |
| 2006-03-01 | 0 | 4.0606% | 1.3878% |
| 2006-04-01 | 0 | 3.8286% | 1.3604% |
| 2006-05-01 | 0 | 4.0353% | 1.4613% |
| 2006-06-01 | 0 | 4.0011% | 1.3327% |
| 2006-07-01 | 0 | 4.0819% | 1.3623% |
| 2006-08-01 | 0 | 3.9307% | 1.2985% |
| 2006-09-01 | 0 | 3.8648% | 1.3382% |
| 2006-10-01 | 0 | 3.9279% | 1.3870% |
| 2006-11-01 | 0 | 4.0092% | 1.4052% |
| 2006-12-01 | 0 | 3.7989% | 1.2911% |
| 2007-01-01 | 0 | 3.9470% | 1.3981% |
| 2007-02-01 | 0 | 3.7511% | 1.3449% |
| 2007-03-01 | 0 | 3.9765% | 1.3659% |
| 2007-04-01 | 0 | 3.8833% | 1.4509% |
| 2007-05-01 | 0 | 3.9633% | 1.4254% |
| 2007-06-01 | 0 | 3.8147% | 1.3363% |
| 2007-07-01 | 0 | 3.7792% | 1.3735% |
| 2007-08-01 | 0 | 3.8822% | 1.4730% |
| 2007-09-01 | 0 | 3.8697% | 1.5844% |
| 2007-10-01 | 0 | 3.9066% | 1.4460% |
| 2007-11-01 | 0 | 3.7429% | 1.4217% |
| 2007-12-01 | 1 | 3.6988% | 1.3837% |
| 2008-01-01 | 1 | 3.6643% | 1.4372% |
| 2008-02-01 | 1 | 3.6702% | 1.4422% |
| 2008-03-01 | 1 | 3.5614% | 1.3873% |
| 2008-04-01 | 1 | 3.5845% | 1.4184% |
| 2008-05-01 | 1 | 3.4029% | 1.4146% |
| 2008-06-01 | 1 | 3.5534% | 1.5773% |
| 2008-07-01 | 1 | 3.3724% | 1.5062% |
| 2008-08-01 | 1 | 3.4123% | 1.5961% |
| 2008-09-01 | 1 | 3.2897% | 1.5268% |
| 2008-10-01 | 1 | 3.3370% | 1.6509% |
| 2008-11-01 | 1 | 3.0279% | 1.6895% |
| 2008-12-01 | 1 | 3.2244% | 1.8406% |
| 2009-01-01 | 1 | 3.0542% | 1.9250% |
| 2009-02-01 | 1 | 3.0461% | 1.9495% |
| 2009-03-01 | 1 | 2.9118% | 1.9435% |
| 2009-04-01 | 1 | 2.9494% | 2.0133% |
| 2009-05-01 | 1 | 2.8585% | 1.6970% |
| 2009-06-01 | 0 | 2.7777% | 1.7258% |
| 2009-07-01 | 0 | 2.9519% | 1.7350% |
| 2009-08-01 | 0 | 2.9202% | 1.6241% |
| 2009-09-01 | 0 | 3.0281% | 1.6853% |
| 2009-10-01 | 0 | 2.9509% | 1.5593% |
| 2009-11-01 | 0 | 3.0940% | 1.4709% |
| 2009-12-01 | 0 | 3.0846% | 1.5662% |
| 2010-01-01 | 0 | 3.0077% | 1.4484% |
| 2010-02-01 | 0 | 2.9790% | 1.4070% |
| 2010-03-01 | 0 | 3.3126% | 1.4815% |
| 2010-04-01 | 0 | 3.1963% | 1.3441% |
| 2010-05-01 | 0 | 3.3833% | 1.3487% |
| 2010-06-01 | 0 | 3.1500% | 1.5899% |
| 2010-07-01 | 0 | 3.1921% | 1.6609% |
| 2010-08-01 | 0 | 3.1024% | 1.4492% |
| 2010-09-01 | 0 | 3.0950% | 1.4055% |
| 2010-10-01 | 0 | 3.1948% | 1.3359% |
| 2010-11-01 | 0 | 3.1985% | 1.4142% |
| 2010-12-01 | 0 | 3.2859% | 1.4171% |
| 2011-01-01 | 0 | 3.0572% | 1.3964% |
| 2011-02-01 | 0 | 3.2284% | 1.3391% |
| 2011-03-01 | 0 | 3.3744% | 1.3665% |
| 2011-04-01 | 0 | 3.2645% | 1.3617% |
| 2011-05-01 | 0 | 3.2353% | 1.4457% |
| 2011-06-01 | 0 | 3.3093% | 1.4720% |
| 2011-07-01 | 0 | 3.2282% | 1.3978% |
| 2011-08-01 | 0 | 3.2530% | 1.3964% |
| 2011-09-01 | 0 | 3.3466% | 1.4145% |
| 2011-10-01 | 0 | 3.2968% | 1.3534% |
| 2011-11-01 | 0 | 3.2896% | 1.4410% |
| 2011-12-01 | 0 | 3.2779% | 1.3553% |
| 2012-01-01 | 0 | 3.3449% | 1.3486% |
| 2012-02-01 | 0 | 3.4155% | 1.4254% |
| 2012-03-01 | 0 | 3.4206% | 1.3339% |
| 2012-04-01 | 0 | 3.2797% | 1.4048% |
| 2012-05-01 | 0 | 3.3846% | 1.4701% |
| 2012-06-01 | 0 | 3.3131% | 1.4118% |
| 2012-07-01 | 0 | 3.2253% | 1.2836% |
| 2012-08-01 | 0 | 3.3125% | 1.4099% |
| 2012-09-01 | 0 | 3.1981% | 1.3418% |
| 2012-10-01 | 0 | 3.2591% | 1.4042% |
| 2012-11-01 | 0 | 3.3295% | 1.4248% |
| 2012-12-01 | 0 | 3.2960% | 1.2586% |
| 2013-01-01 | 0 | 3.3174% | 1.2406% |
| 2013-02-01 | 0 | 3.3723% | 1.2276% |
| 2013-03-01 | 0 | 3.2199% | 1.3170% |
| 2013-04-01 | 0 | 3.3649% | 1.3196% |
| 2013-05-01 | 0 | 3.4263% | 1.3490% |
| 2013-06-01 | 0 | 3.2580% | 1.2922% |
| 2013-07-01 | 0 | 3.3441% | 1.2559% |
| 2013-08-01 | 0 | 3.4615% | 1.3290% |
| 2013-09-01 | 0 | 3.4541% | 1.3828% |
| 2013-10-01 | 0 | 3.2968% | 1.2223% |
| 2013-11-01 | 0 | 3.3659% | 1.1870% |
| 2013-12-01 | 0 | 3.3588% | 1.2885% |
| 2014-01-01 | 0 | 3.3629% | 1.3129% |
| 2014-02-01 | 0 | 3.4100% | 1.2831% |
| 2014-03-01 | 0 | 3.4518% | 1.2342% |
| 2014-04-01 | 0 | 3.5286% | 1.2755% |
| 2014-05-01 | 0 | 3.4712% | 1.2345% |
| 2014-06-01 | 0 | 3.5470% | 1.2683% |
| 2014-07-01 | 0 | 3.6010% | 1.2806% |
| 2014-08-01 | 0 | 3.4537% | 1.2199% |
| 2014-09-01 | 0 | 3.6894% | 1.2310% |
| 2014-10-01 | 0 | 3.6560% | 1.3126% |
| 2014-11-01 | 0 | 3.5535% | 1.2321% |
| 2014-12-01 | 0 | 3.6990% | 1.3230% |
| 2015-01-01 | 0 | 3.6004% | 1.2727% |
| 2015-02-01 | 0 | 3.6406% | 1.2476% |
| 2015-03-01 | 0 | 3.6374% | 1.4001% |
| 2015-04-01 | 0 | 3.6800% | 1.3145% |
| 2015-05-01 | 0 | 3.6329% | 1.2089% |
| 2015-06-01 | 0 | 3.6166% | 1.2850% |
| 2015-07-01 | 0 | 3.6270% | 1.1994% |
| 2015-08-01 | 0 | 3.6327% | 1.2475% |
| 2015-09-01 | 0 | 3.7160% | 1.3804% |
| 2015-10-01 | 0 | 3.7439% | 1.2940% |
| 2015-11-01 | 0 | 3.7519% | 1.2457% |
| 2015-12-01 | 0 | 3.8720% | 1.2602% |
| 2016-01-01 | 0 | 3.6450% | 1.2604% |
| 2016-02-01 | 0 | 3.8143% | 1.3207% |
| 2016-03-01 | 0 | 3.7303% | 1.2877% |
| 2016-04-01 | 0 | 3.6801% | 1.2311% |
| 2016-05-01 | 0 | 3.6115% | 1.2682% |
| 2016-06-01 | 0 | 3.6636% | 1.2140% |
| 2016-07-01 | 0 | 3.7545% | 1.2171% |
| 2016-08-01 | 0 | 3.6824% | 1.2858% |
| 2016-09-01 | 0 | 3.6601% | 1.0954% |
| 2016-10-01 | 0 | 3.5915% | 1.1471% |
| 2016-11-01 | 0 | 3.6561% | 1.2061% |
| 2016-12-01 | 0 | 3.6745% | 1.1746% |
| 2017-01-01 | 0 | 3.7761% | 1.1983% |
| 2017-02-01 | 0 | 3.6683% | 1.1732% |
| 2017-03-01 | 0 | 3.6960% | 1.2071% |
| 2017-04-01 | 0 | 3.6066% | 1.1698% |
| 2017-05-01 | 0 | 3.7416% | 1.2256% |
| 2017-06-01 | 0 | 3.8442% | 1.3439% |
| 2017-07-01 | 0 | 3.7453% | 1.3013% |
| 2017-08-01 | 0 | 3.7565% | 1.2714% |
| 2017-09-01 | 0 | 3.7073% | 1.2156% |
| 2017-10-01 | 0 | 3.7928% | 1.2484% |
| 2017-11-01 | 0 | 3.7280% | 1.1854% |
| 2017-12-01 | 0 | 3.6747% | 1.1741% |
| 2018-01-01 | 0 | 3.7329% | 1.3084% |
| 2018-02-01 | 0 | 3.7986% | 1.1962% |
| 2018-03-01 | 0 | 3.7921% | 1.2105% |
| 2018-04-01 | 0 | 3.7663% | 1.1636% |
| 2018-05-01 | 0 | 3.9390% | 1.1933% |
| 2018-06-01 | 0 | 3.8668% | 1.2231% |
| 2018-07-01 | 0 | 3.7908% | 1.2119% |
| 2018-08-01 | 0 | 3.8954% | 1.2078% |
| 2018-09-01 | 0 | 3.7661% | 1.1811% |
| 2018-10-01 | 0 | 3.9505% | 1.2125% |
| 2018-11-01 | 0 | 3.8939% | 1.2953% |
| 2018-12-01 | 1 | 3.8502% | 1.2276% |
| 2019-01-01 | 1 | 3.8558% | 1.1362% |
| 2019-02-01 | 0 | 3.8010% | 1.1748% |
| 2019-03-01 | 0 | 3.7852% | 1.1245% |
| 2019-04-01 | 0 | 3.9949% | 1.3035% |
| 2019-05-01 | 0 | 3.7751% | 1.1785% |
| 2019-06-01 | 0 | 3.8458% | 1.1801% |
| 2019-07-01 | 0 | 3.8897% | 1.2144% |
| 2019-08-01 | 0 | 3.9029% | 1.1960% |
| 2019-09-01 | 0 | 3.9395% | 1.3015% |
| 2019-10-01 | 0 | 3.8168% | 1.2010% |
| 2019-11-01 | 0 | 3.8552% | 1.1749% |
| 2019-12-01 | 0 | 3.9204% | 1.2721% |
| 2020-01-01 | 0 | 3.9341% | 1.1892% |
| 2020-02-01 | 0 | 3.9332% | 1.2831% |
| 2020-03-01 | 0 | 3.4269% | 8.6053% |
| 2020-04-01 | 0 | 3.0891% | 7.0308% |
| 2020-05-01 | 0 | 6.1132% | 1.6078% |
| 2020-06-01 | 0 | 5.4311% | 1.6307% |
| 2020-07-01 | 0 | 4.5384% | 1.3120% |
| 2020-08-01 | 0 | 4.2636% | 1.1078% |
| 2020-09-01 | 0 | 4.2082% | 1.1053% |
| 2020-10-01 | 0 | 4.2756% | 1.1912% |
| 2020-11-01 | 0 | 4.1294% | 1.4692% |
| 2020-12-01 | 0 | 3.9124% | 1.3371% |
| 2021-01-01 | 0 | 3.9184% | 1.0969% |
| 2021-02-01 | 0 | 4.0543% | 1.1354% |
| 2021-03-01 | 0 | 4.2695% | 1.0400% |
| 2021-04-01 | 0 | 4.2452% | 0.9697% |
| 2021-05-01 | 0 | 4.1230% | 0.9313% |
| 2021-06-01 | 0 | 4.4816% | 0.9155% |
| 2021-07-01 | 0 | 4.5788% | 0.9607% |
| 2021-08-01 | 0 | 4.3404% | 0.9042% |
| 2021-09-01 | 0 | 4.4880% | 0.9549% |
| 2021-10-01 | 0 | 4.4948% | 0.8837% |
| 2021-11-01 | 0 | 4.6311% | 0.9033% |
| 2021-12-01 | 0 | 4.4628% | 0.9365% |
| 2022-01-01 | 0 | 4.2872% | 0.9486% |
| 2022-02-01 | 0 | 4.5092% | 0.9289% |
| 2022-03-01 | 0 | 4.3743% | 0.9100% |
| 2022-04-01 | 0 | 4.3054% | 0.8653% |
| 2022-05-01 | 0 | 4.2390% | 0.9873% |
| 2022-06-01 | 0 | 4.2577% | 1.0029% |
| 2022-07-01 | 0 | 4.2320% | 0.9551% |
| 2022-08-01 | 0 | 4.2044% | 1.0472% |
| 2022-09-01 | 0 | 4.0376% | 0.9409% |
| 2022-10-01 | 0 | 3.9957% | 1.0088% |
| 2022-11-01 | 0 | 4.0067% | 0.9543% |
| 2022-12-01 | 0 | 3.9931% | 0.9945% |
| 2023-01-01 | 0 | 4.1156% | 1.1416% |
| 2023-02-01 | 0 | 3.8622% | 0.9899% |
| 2023-03-01 | 0 | 3.8193% | 1.2267% |
| 2023-04-01 | 0 | 3.7818% | 1.0645% |
| 2023-05-01 | 0 | 3.9311% | 0.9894% |
| 2023-06-01 | 0 | 3.8029% | 1.0636% |
| 2023-07-01 | 0 | 3.6349% | 1.0747% |
| 2023-08-01 | 0 | 3.7412% | 1.0719% |
| 2023-09-01 | 0 | 3.6908% | 0.9788% |
| 2023-10-01 | 0 | 3.6819% | 1.0366% |
| 2023-11-01 | 0 | 3.5322% | 0.9917% |
| 2023-12-01 | 0 | 3.5593% | 1.0742% |
| 2024-01-01 | 0 | 3.5604% | 1.0450% |
| 2024-02-01 | 0 | 3.5729% | 1.0761% |
| 2024-03-01 | 0 | 3.4623% | 1.0459% |
| 2024-04-01 | 0 | 3.4717% | 0.9827% |
| 2024-05-01 | 0 | 3.4846% | 1.1084% |
| 2024-06-01 | 0 | 3.2576% | 0.9493% |
| 2024-07-01 | 0 | 3.4422% | 1.0846% |
| 2024-08-01 | 0 | 3.2987% | 1.0668% |
| 2024-09-01 | 0 | 3.4367% | 1.1272% |
| 2024-10-01 | 0 | 3.3100% | 1.0447% |
| 2024-11-01 | 0 | 3.2610% | 1.1583% |
| 2024-12-01 | 0 | 3.3427% | 1.0669% |
| 2025-01-01 | 0 | 3.3096% | 1.0981% |
| 2025-02-01 | 0 | 3.3074% | 1.1793% |
| 2025-03-01 | 0 | 3.3673% | 1.0071% |
| 2025-04-01 | 0 | 3.4016% | 1.1471% |
| 2025-05-01 | 0 | 3.3616% | 1.0543% |
| 2025-06-01 | 0 | 3.3613% | 1.1629% |
| 2025-07-01 | 0 | 3.2957% | 1.1177% |
| 2025-08-01 | 0 | 3.2466% | 1.1560% |
| 2025-09-01 | 0 | 3.3075% | 1.1454% |
| 2025-10-01 | 0 | 3.2700% | 1.1938% |
| 2025-11-01 | 0 | 3.1676% | 1.0477% |
| 2025-12-01 | 0 | 3.3276% | 1.0516% |
| 2026-01-01 | 0 | 3.3715% | 1.0467% |
| 2026-02-01 | 0 | 3.0921% | 1.0818% |
| 2026-03-01 | 0 | 3.4888% | 1.1875% |
| 2026-04-01 | 0 | 3.2840% | 1.0498% |
| 2026-05-01 | 0 | 3.2531% | 1.0747% |
Chart 2: Core PCE vs. Trimmed Mean vs. Supercore Inflation
| Date | Core PCE | Trimmed Mean | Supercore |
| 2019-01-31 | 1.8440% | 1.9100% | 2.3150% |
| 2019-02-28 | 1.7440% | 1.9700% | 2.1878% |
| 2019-03-31 | 1.6160% | 2.0100% | 2.0366% |
| 2019-04-30 | 1.6370% | 2.1300% | 2.1769% |
| 2019-05-31 | 1.5630% | 2.0400% | 2.0566% |
| 2019-06-30 | 1.6570% | 2.0000% | 2.0212% |
| 2019-07-31 | 1.6390% | 2.0400% | 2.0351% |
| 2019-08-31 | 1.7460% | 2.0500% | 2.0564% |
| 2019-09-30 | 1.6320% | 1.9900% | 1.8870% |
| 2019-10-31 | 1.6240% | 1.9700% | 1.9328% |
| 2019-11-30 | 1.4980% | 1.8800% | 1.8018% |
| 2019-12-31 | 1.5450% | 1.8800% | 1.8661% |
| 2020-01-31 | 1.5910% | 1.9300% | 2.0677% |
| 2020-02-29 | 1.6980% | 1.9300% | 2.1323% |
| 2020-03-31 | 1.5270% | 1.8500% | 1.9449% |
| 2020-04-30 | 0.9950% | 1.7300% | 1.3138% |
| 2020-05-31 | 0.9970% | 1.7900% | 1.4591% |
| 2020-06-30 | 0.9700% | 1.7900% | 1.5591% |
| 2020-07-31 | 1.2140% | 1.8400% | 1.6773% |
| 2020-08-31 | 1.3930% | 1.8400% | 1.7698% |
| 2020-09-30 | 1.4800% | 1.8500% | 2.0064% |
| 2020-10-31 | 1.4220% | 1.8000% | 1.9257% |
| 2020-11-30 | 1.4540% | 1.7500% | 1.9154% |
| 2020-12-31 | 1.5090% | 1.7400% | 1.9503% |
| 2021-01-31 | 1.6970% | 1.7400% | 2.2253% |
| 2021-02-28 | 1.7090% | 1.7300% | 2.3982% |
| 2021-03-31 | 2.1990% | 1.8300% | 3.0708% |
| 2021-04-30 | 3.1310% | 1.9400% | 3.8543% |
| 2021-05-31 | 3.5410% | 2.0500% | 3.9875% |
| 2021-06-30 | 3.8620% | 2.1200% | 4.1730% |
| 2021-07-31 | 3.9270% | 2.1500% | 4.3985% |
| 2021-08-31 | 3.9580% | 2.2600% | 4.4539% |
| 2021-09-30 | 4.0140% | 2.5200% | 4.3320% |
| 2021-10-31 | 4.4370% | 2.8100% | 4.5123% |
| 2021-11-30 | 4.8910% | 3.0900% | 5.0188% |
| 2021-12-31 | 5.2150% | 3.3600% | 5.2112% |
| 2022-01-31 | 5.3580% | 3.7000% | 5.0482% |
| 2022-02-28 | 5.6030% | 3.9100% | 5.0405% |
| 2022-03-31 | 5.5930% | 4.0000% | 5.0144% |
| 2022-04-30 | 5.3450% | 4.0700% | 5.0201% |
| 2022-05-31 | 5.1840% | 4.2700% | 4.9349% |
| 2022-06-30 | 5.3160% | 4.6600% | 5.0399% |
| 2022-07-31 | 5.1070% | 4.7600% | 4.6487% |
| 2022-08-31 | 5.3620% | 5.0100% | 4.9201% |
| 2022-09-30 | 5.6060% | 4.9900% | 5.1696% |
| 2022-10-31 | 5.4600% | 5.0100% | 5.3277% |
| 2022-11-30 | 5.2080% | 4.9700% | 5.1458% |
| 2022-12-31 | 4.9670% | 4.9200% | 4.9495% |
| 2023-01-31 | 4.9380% | 4.8500% | 5.0741% |
| 2023-02-28 | 4.8560% | 4.8200% | 5.0451% |
| 2023-03-31 | 4.7830% | 4.8600% | 4.7933% |
| 2023-04-30 | 4.7900% | 4.9100% | 4.7854% |
| 2023-05-31 | 4.7320% | 4.7600% | 4.7081% |
| 2023-06-30 | 4.3840% | 4.3700% | 4.5388% |
| 2023-07-31 | 4.2990% | 4.2300% | 4.6804% |
| 2023-08-31 | 3.8280% | 3.9100% | 4.2368% |
| 2023-09-30 | 3.6880% | 3.8300% | 4.2180% |
| 2023-10-31 | 3.4740% | 3.6000% | 3.8379% |
| 2023-11-30 | 3.2910% | 3.4500% | 3.6388% |
| 2023-12-31 | 3.1120% | 3.2700% | 3.5474% |
| 2024-01-31 | 3.1590% | 3.2500% | 3.8983% |
| 2024-02-29 | 3.0590% | 3.1600% | 3.7441% |
| 2024-03-31 | 3.1220% | 3.1400% | 3.9157% |
| 2024-04-30 | 3.0070% | 3.0200% | 3.7670% |
| 2024-05-31 | 2.7710% | 2.9000% | 3.6123% |
| 2024-06-30 | 2.7530% | 2.9100% | 3.5335% |
| 2024-07-31 | 2.8060% | 2.8600% | 3.4764% |
| 2024-08-31 | 2.8730% | 2.8100% | 3.6084% |
| 2024-09-30 | 2.8390% | 2.8000% | 3.5341% |
| 2024-10-31 | 2.9870% | 2.8700% | 3.8529% |
| 2024-11-30 | 2.9810% | 2.9000% | 3.8077% |
| 2024-12-31 | 2.9890% | 2.9800% | 3.8638% |
| 2025-01-31 | 2.7800% | 2.7700% | 3.3537% |
| 2025-02-28 | 2.9690% | 2.7300% | 3.6902% |
| 2025-03-31 | 2.6700% | 2.6500% | 3.3469% |
| 2025-04-30 | 2.6150% | 2.6400% | 3.1662% |
| 2025-05-31 | 2.7840% | 2.6100% | 3.3108% |
| 2025-06-30 | 2.8070% | 2.7000% | 3.2068% |
| 2025-07-31 | 2.8630% | 2.6900% | 3.3120% |
| 2025-08-31 | 2.9120% | 2.8000% | 3.4138% |
| 2025-09-30 | 2.8250% | 2.7000% | 3.2596% |
| 2025-10-31 | 2.7550% | 2.5500% | 3.2389% |
| 2025-11-30 | 2.8290% | 2.5100% | 3.3571% |
| 2025-12-31 | 2.9710% | 2.4400% | 3.2945% |
| 2026-01-31 | 3.1050% | 2.4100% | 3.5991% |
| 2026-02-28 | 3.0490% | 2.3400% | 3.3447% |
| 2026-03-31 | 3.2540% | 2.3600% | 3.5307% |
| 2026-04-30 | 3.3190% | 2.3400% | 3.5800% |
| 2026-05-31 | 3.4120% | 2.4100% | 3.8784% |