


CONSUMER HEALTH CHECK | OCTOBER 2026
Gen Z versus Millennials
Gen Z leads Millennials on most financial measures, but priced out and feeling worse.

By Brian LeBlanc
Head of Economic Analysis, PNC Economics Research
Economist's Note
Gen Z has built a stronger financial foundation than Millennials, but affordability challenges continue to weigh on the generation's outlook.


Spending Still Healthy in September, Balances Still Increasing
Consumer spending remains resilient, supported by healthy household finances.
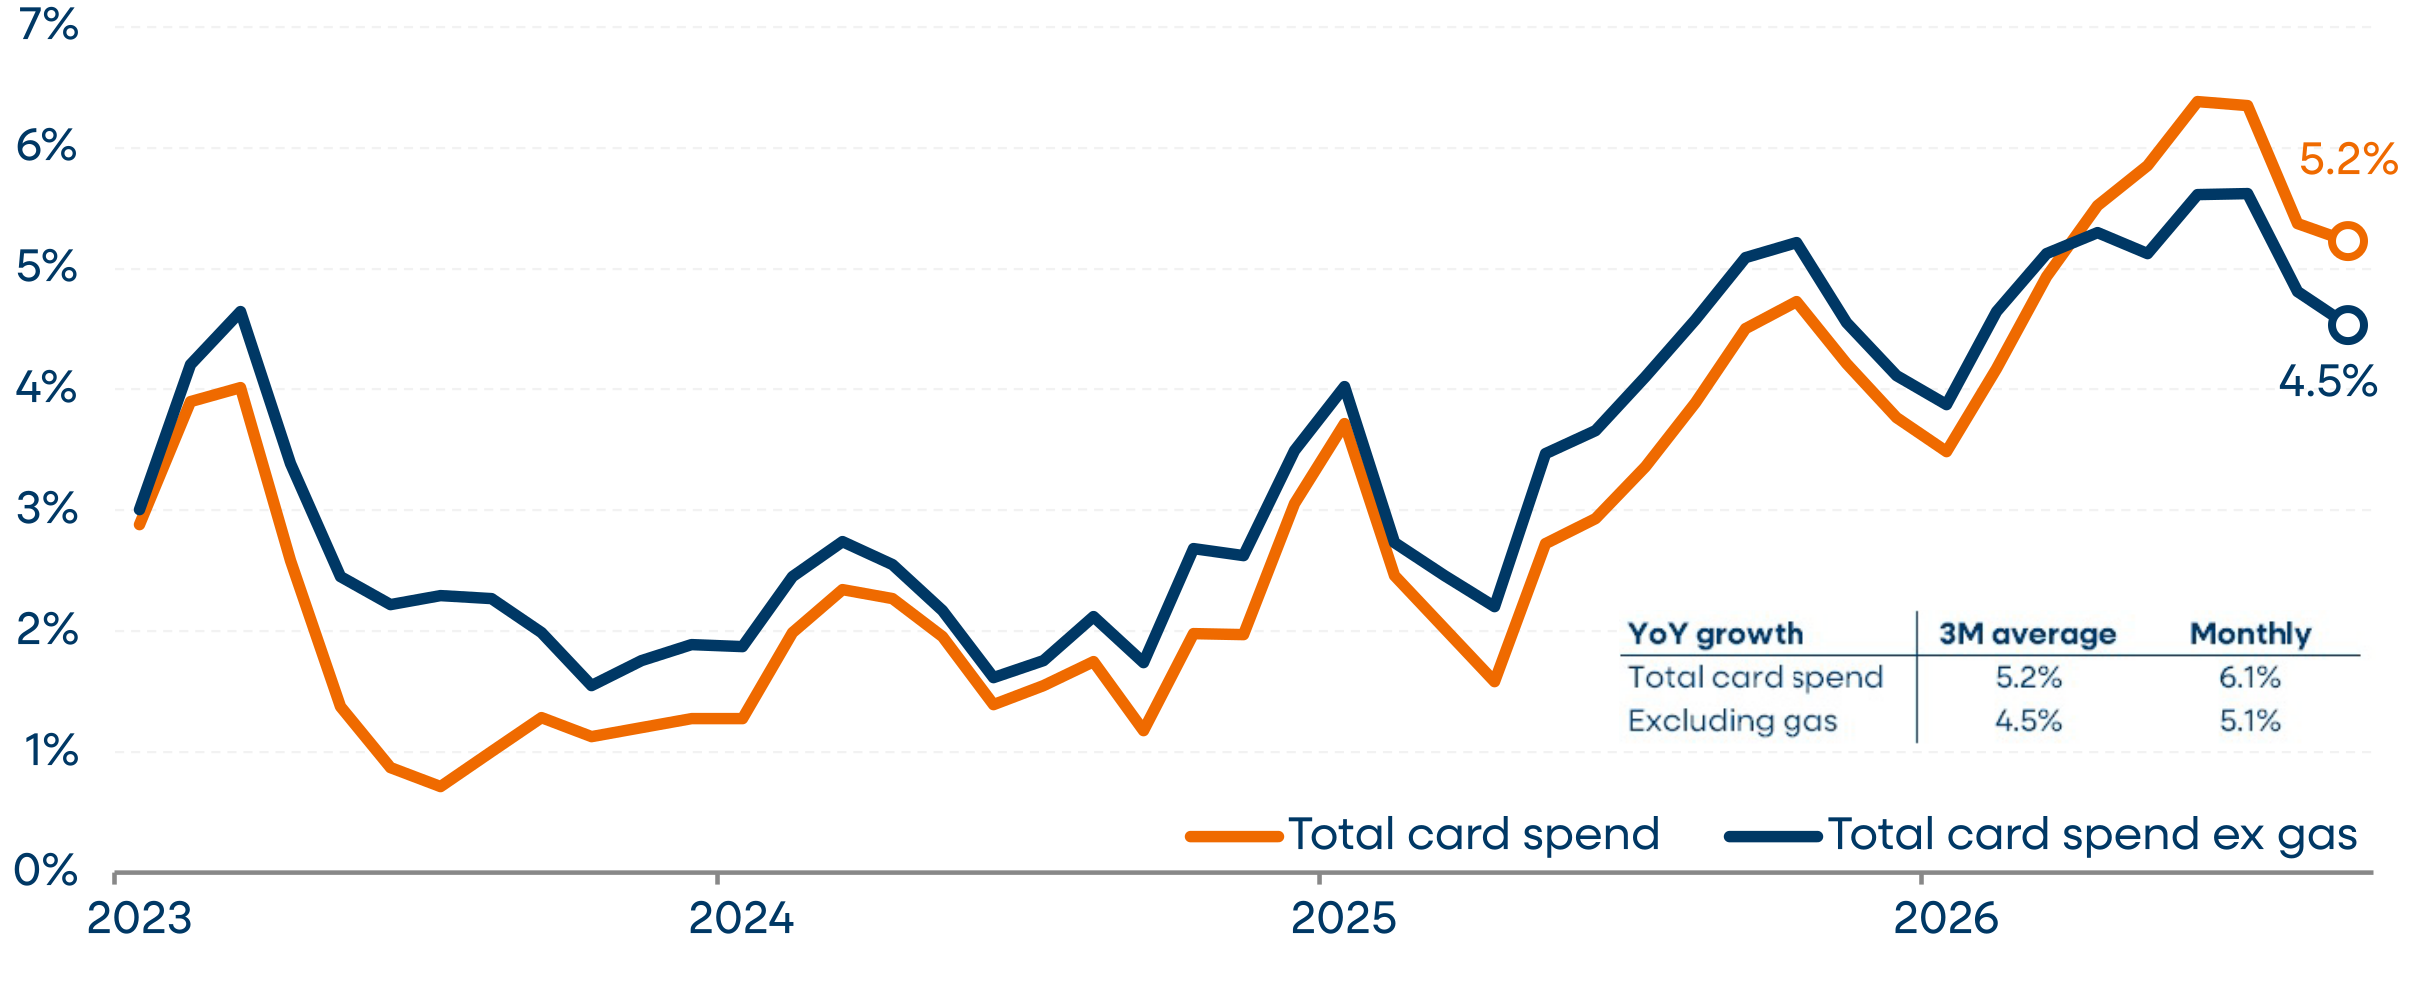
Total card spending rose 6.1% year-over-year (YoY) in September, or 5.1% excluding gas, rebounding from a weaker August that was weighed down by Labor Day–related calendar effects. Total credit and debit spending ex. gas has averaged 4.5% over the past three months, which we feel is a more accurate representation of trend spending growth heading into the fourth quarter of 2026. Larger tax refunds helped boost spending growth earlier in the year, and spending slowed modestly in Q3 as that impulse faded.
Figure 1: YoY percentage change in combined debit and credit card spending, 3M moving average
Source: PNC internal data
Note: Growth in card spend is computed as a year-over-year percentage change in the three-month moving average of the level value
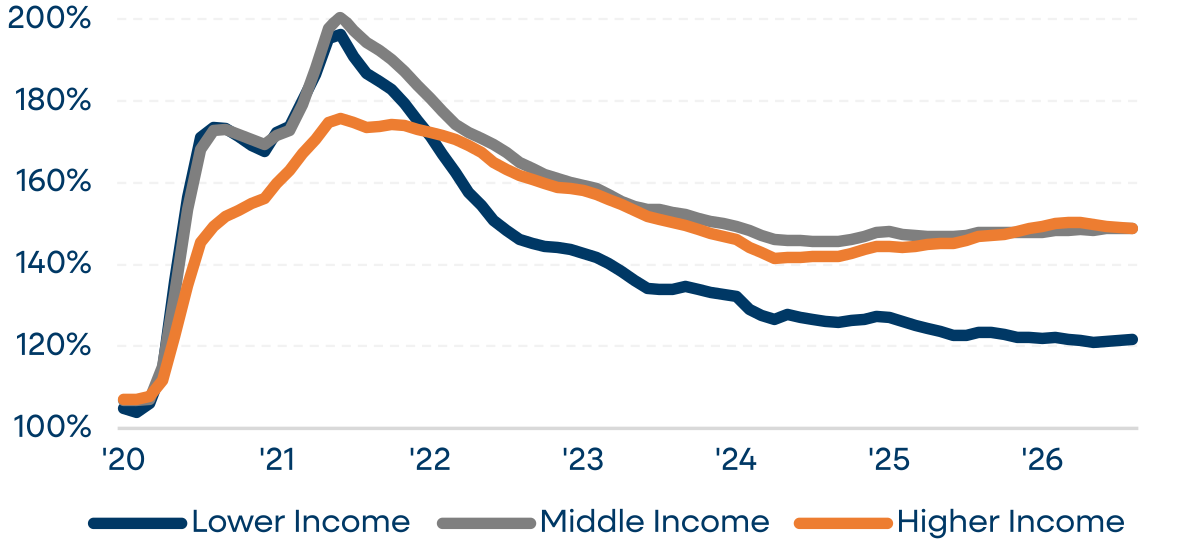
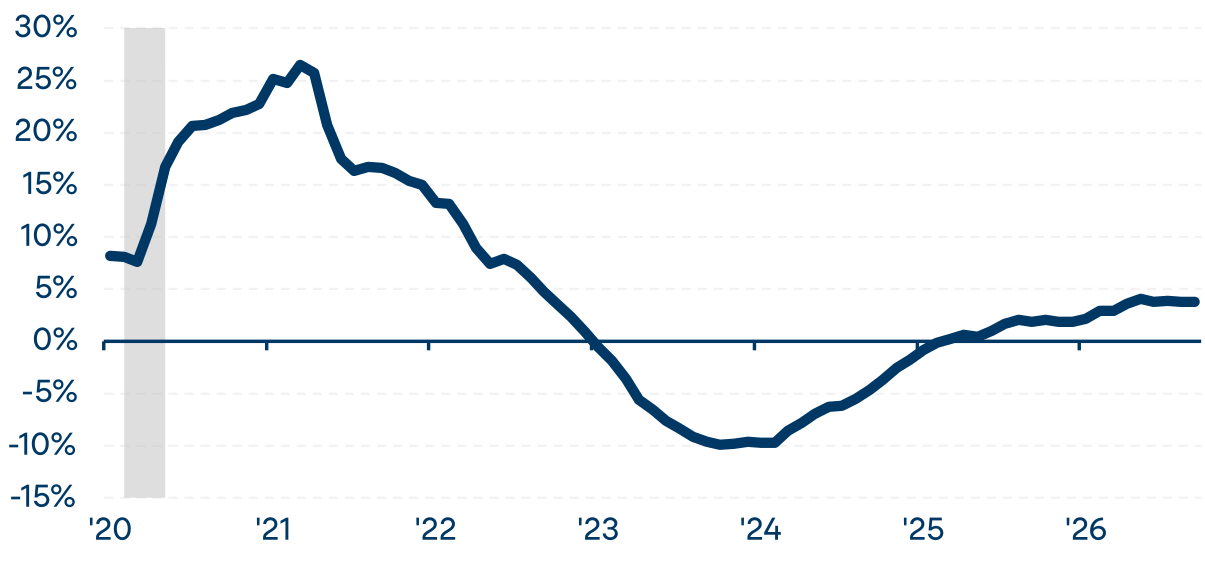
Consumer balance sheets remain much healthier than many give them credit for, which should continue to support spending in the coming quarters. Average checking and savings balances have been growing faster than inflation since last March and remain well above pre-pandemic norms for all income groups. Cash savings buffers are stable, and the share of households we estimate are living "paycheck-to-paycheck" remains below pre-pandemic levels.
Figure 2: Median inflation-adjusted checking and savings deposit balances as a % of ‘19 levels (3M MA)
Source: PNC internal data
Note: Chart shows data seasonally adjusted by PNC and deflated using total consumer price index, 3-month moving average (3M MA)
Figure 3: YoY growth rate of average consumer checking and savings balances
Source: PNC internal data
Note: Chart shows YoY growth rates of average checking/savings account balances
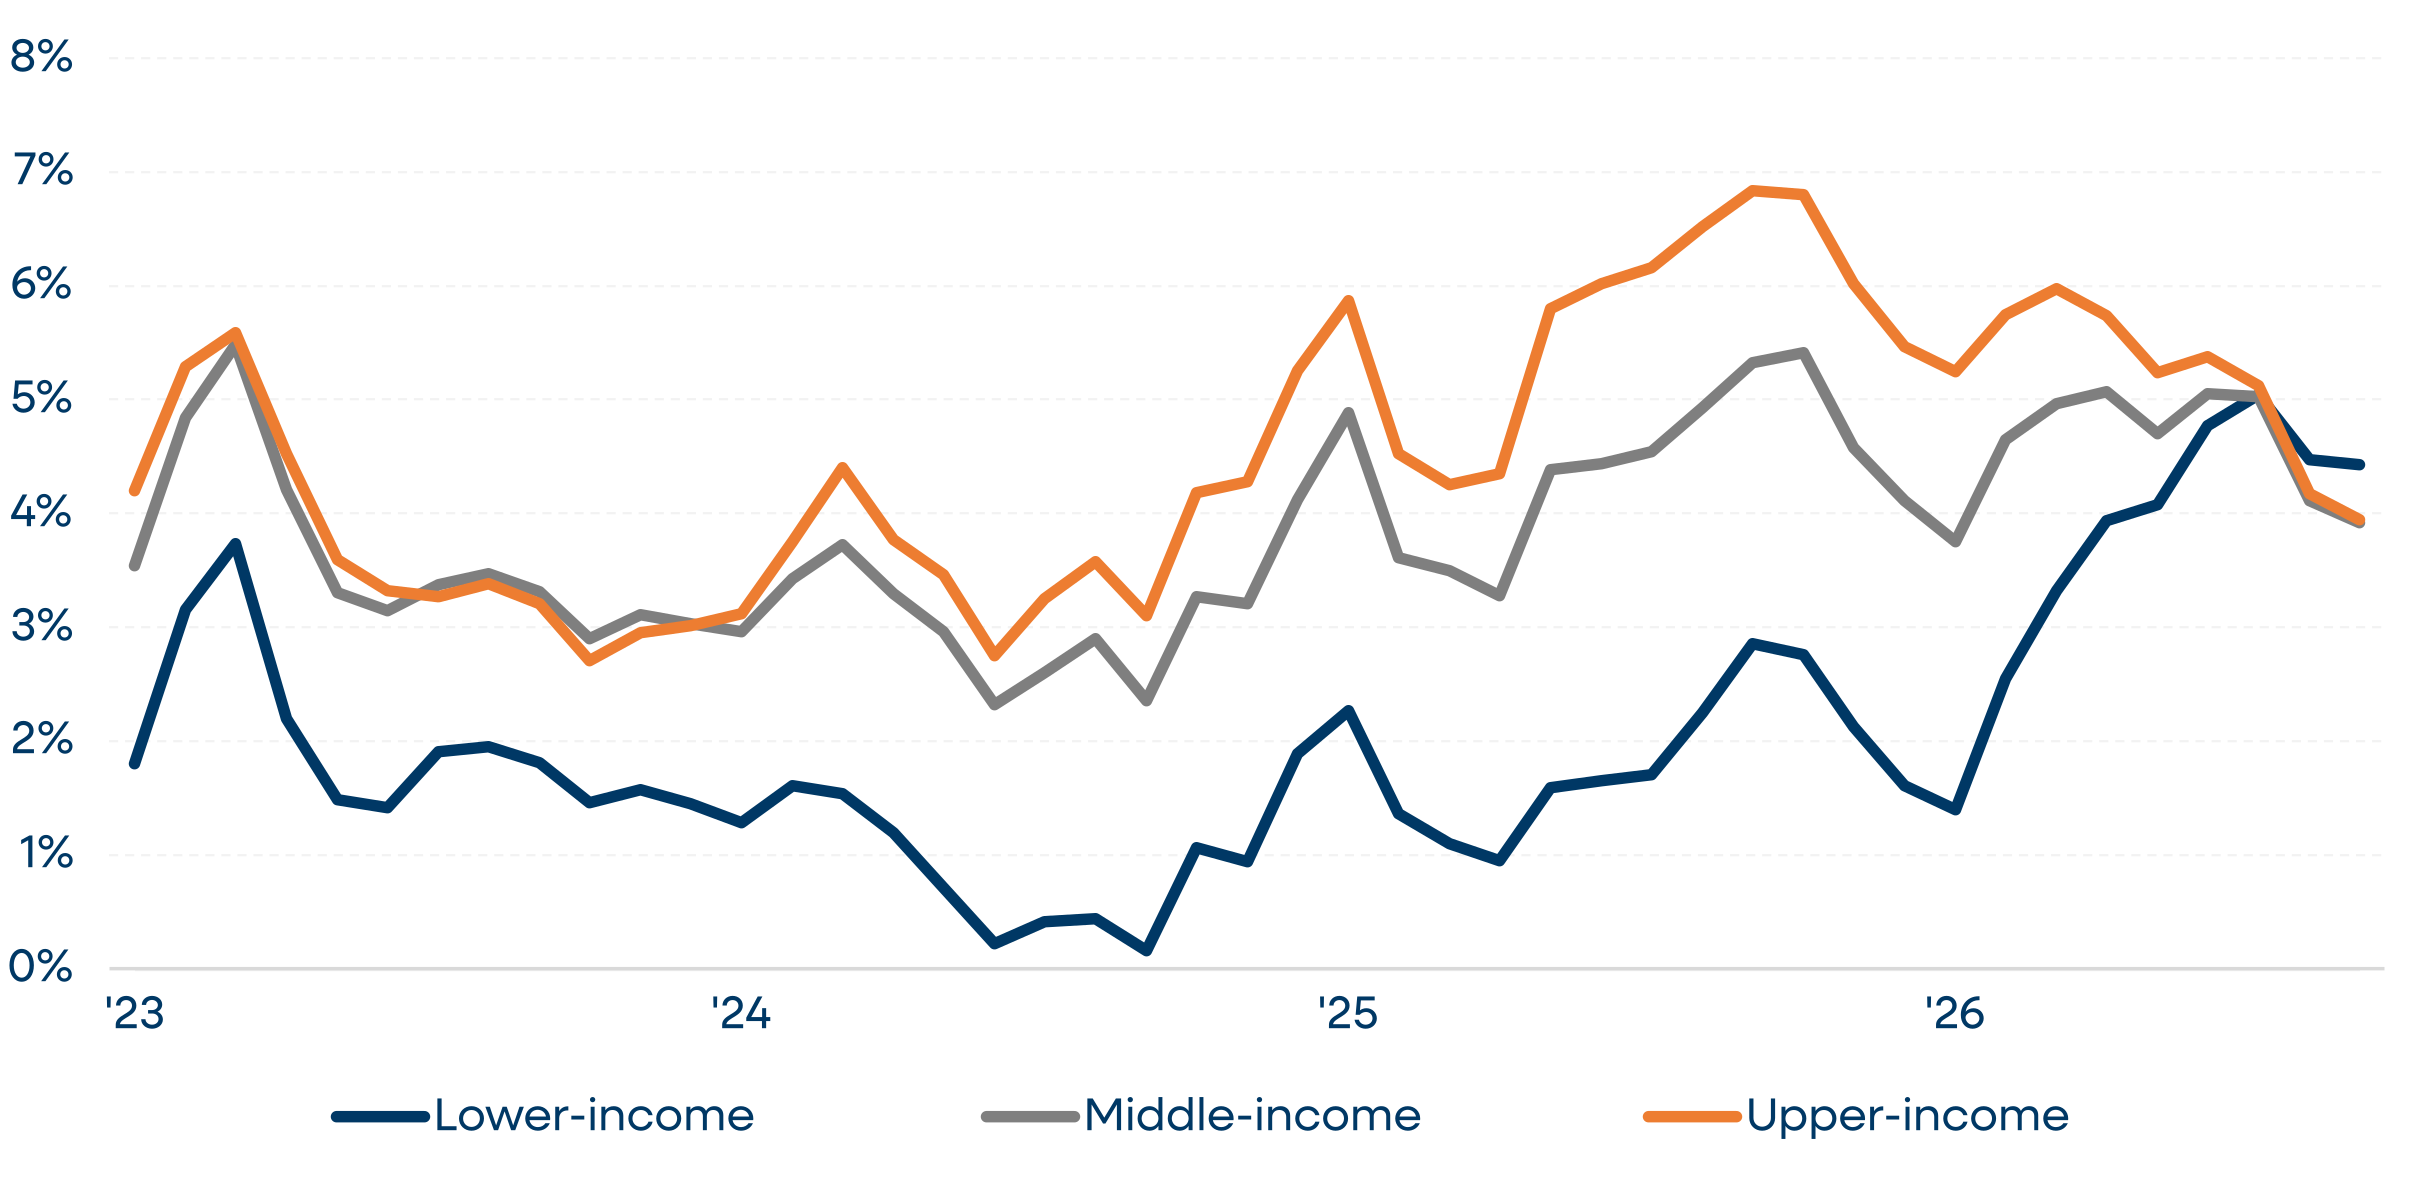
The most encouraging development in 2026 has been the improvement in lower-income household spending, which as of September is growing faster than that of middle- and upper-income households. A stronger labor market is helping to support lower-income spending, and we're encouraged that this trend has continued even after the boost from larger tax refunds faded.
Figure 4: YoY percentage change in combined debit and credit card spending (ex. gas) by income thirds
Source: PNC internal data
Note: Growth in card spend is computed as a year-over-year percentage change in the three-month moving average of the level value.
Gen Z better off than same-age Millennials on almost every measure, but priced out and feeling worse about prospects
With most of Gen Z now in adulthood (the oldest turn 29 this year), it’s worth taking stock of how their economic realities compare with those of Millennials when they were the same age. Both generations entered adulthood and the labor market at unusual and (frankly) tumultuous times. For Millennials, it was the fallout from the Global Financial Crisis and the incredibly weak labor market that dragged on for much of the 2010s. For Gen Z, it has been a litany of disruptions and unique challenges, from COVID-19 to the rise of work-from-home, stark affordability challenges, and now artificial intelligence.
To make this comparison, we look at the two generations from multiple angles, using internal PNC checking and savings account data alongside publicly available data: (1) income & spending patterns, (2) labor market prospects, (3) savings & wealth accumulation, (4) overall debt burden, (5) housing and affordability, and (6) overall sentiment.
The short answer is this: despite the multitude of challenges Gen Z has faced in their first few years of adulthood, they are ahead of Millennials on almost every measure. They earn more in inflation-adjusted terms, they are more gainfully employed, and they are wealthier. Perhaps unsurprisingly, the exceptions are cost of living and sentiment. Affordability challenges have, in our view, left Gen Z feeling priced out of many important life goals, like owning a house. As a result, Gen Z has spent most of the past two years less optimistic about the economy than older Americans, a reversal of the “youth optimism” typically seen in the data.
Gen Z out-earns same-age Millennials by ~30% in real terms
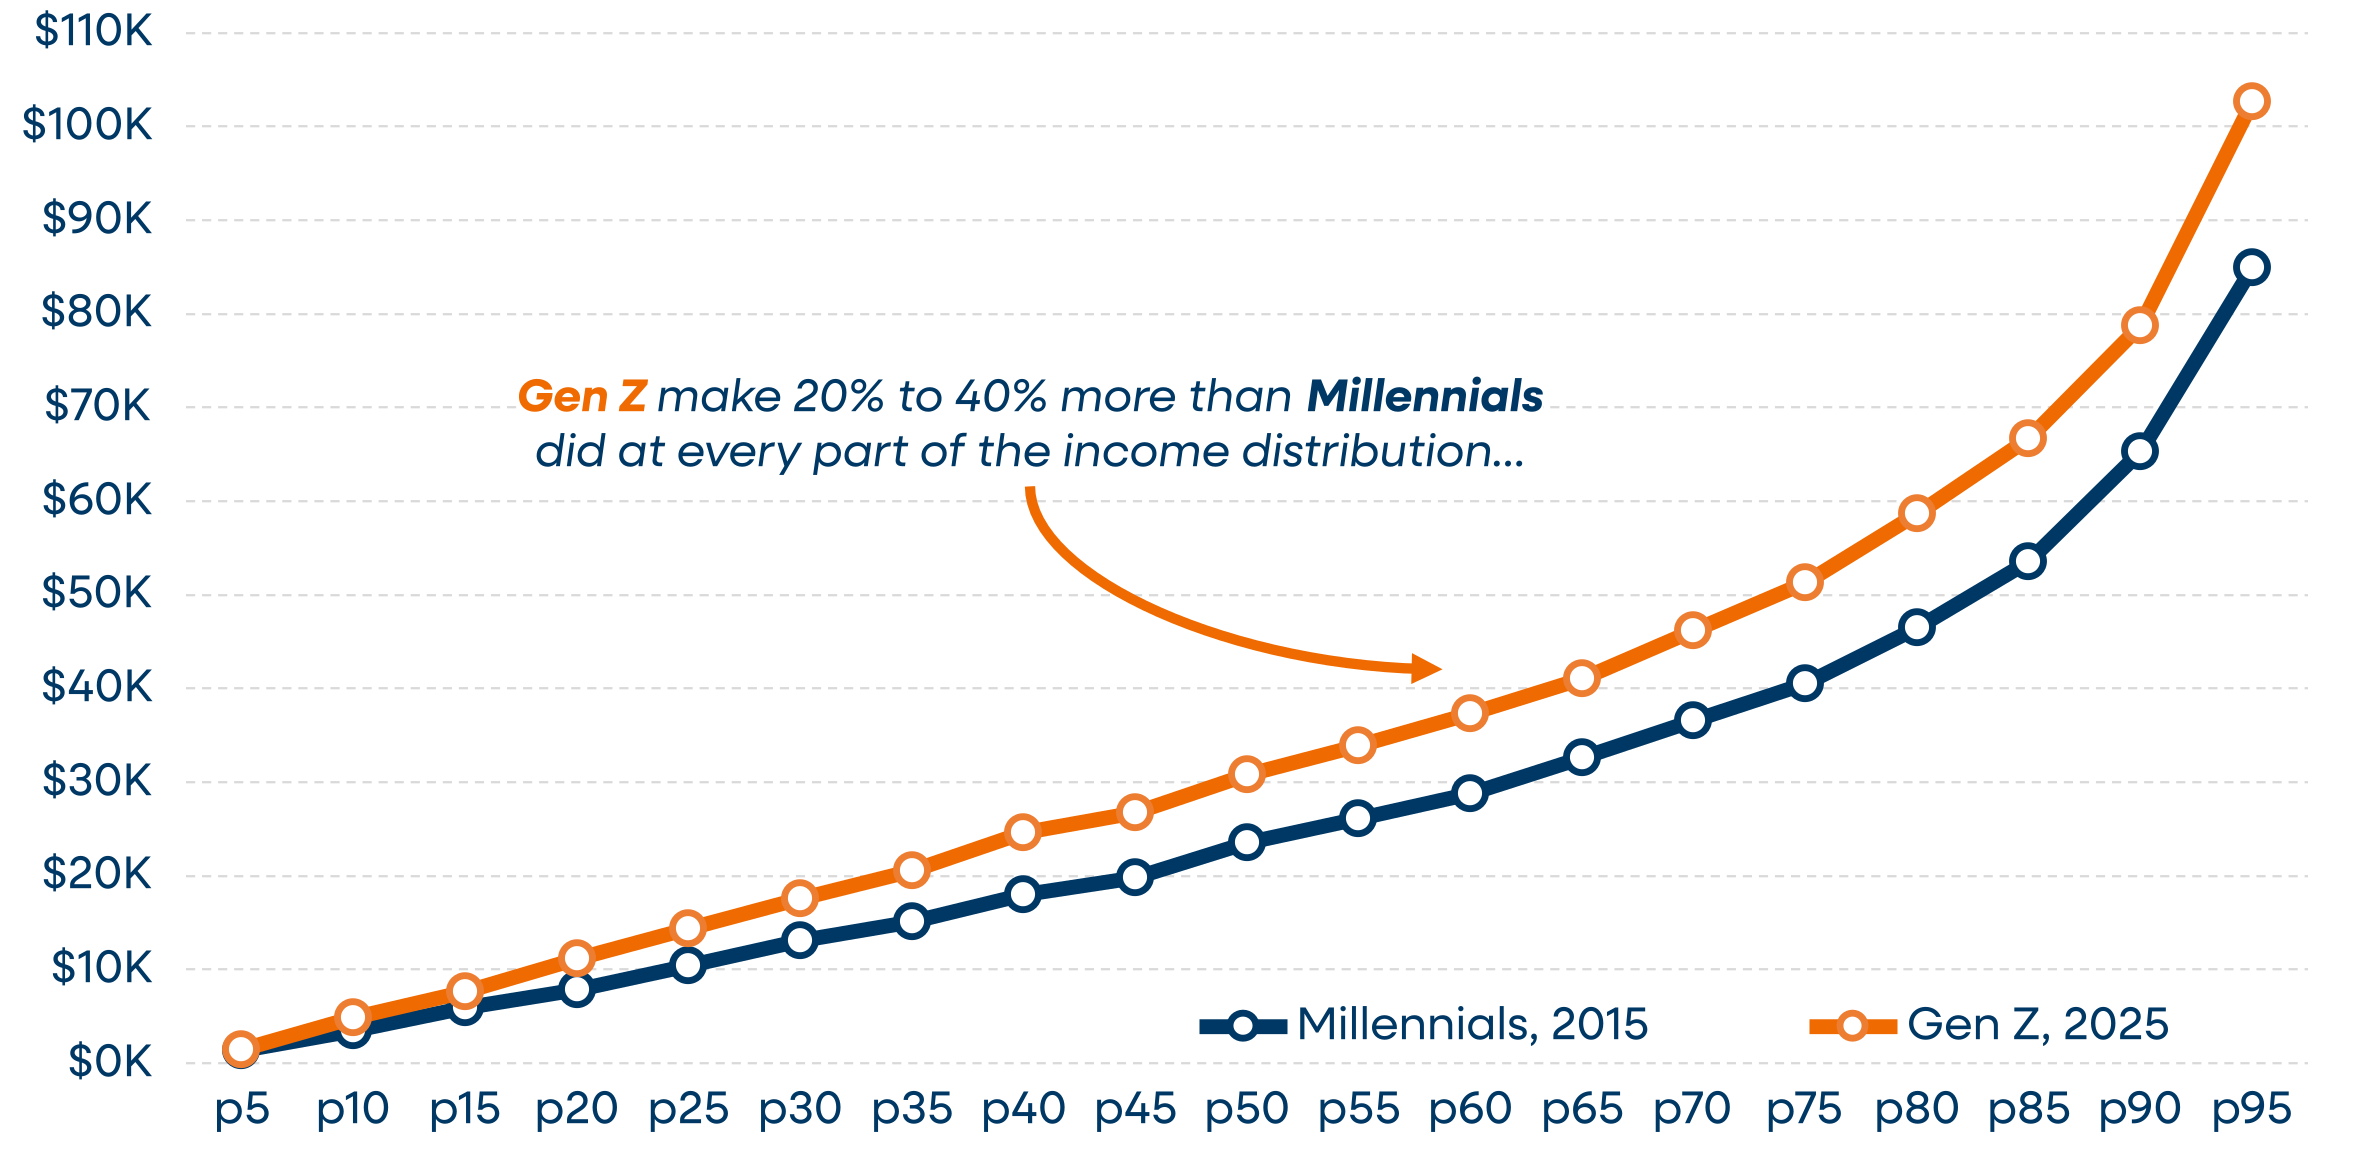
Stronger incomes and wages for Gen Z across the entire income distribution
Looking first at income, it's clear that Gen Z earns materially more than Millennials did at a similar age on an inflation-adjusted basis. This is true across the entire income distribution, and it holds up across a wide range of data sources and income measures. Median total income (+30.9%) and median wage earnings (+29.5%) from the Census ASEC for ages 19-27, mean earnings from administrative UI wage records (+28.1%) for ages 22-24, and median weekly earnings of full time workers from the CPS (+22.4%) for ages 22-24 all show considerable real wage growth for Gen Z relative to when Millennials were a similar age in the mid-2010s.
Figure 5: Annual Real Incomes by Percentiles, Gen Z vs. Millennials
Source: Census CPS ASEC microdata
Note: Millennials in 2015 vs. Gen Z in 2025, inflation-adjusted using the PCE price index
Gen Z earns slightly more income from asset holdings, less government and educational assistance relative to Millennials
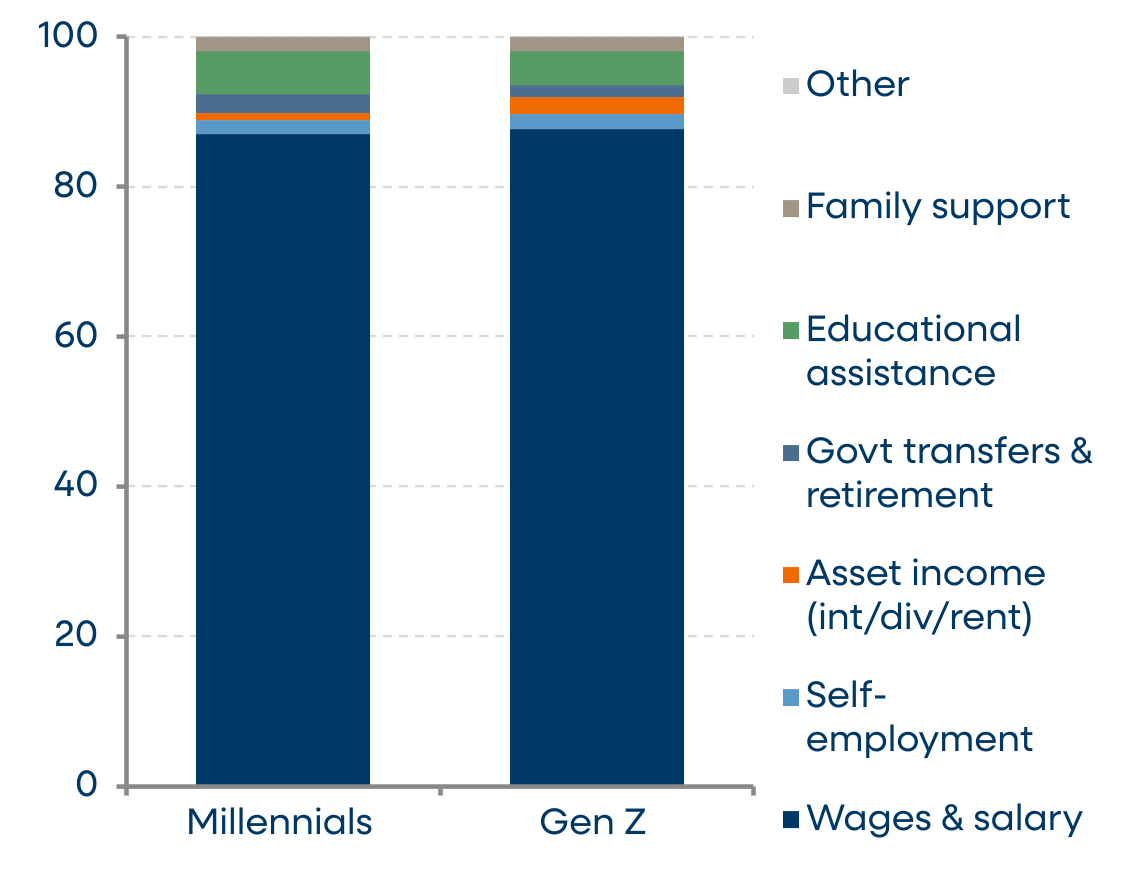
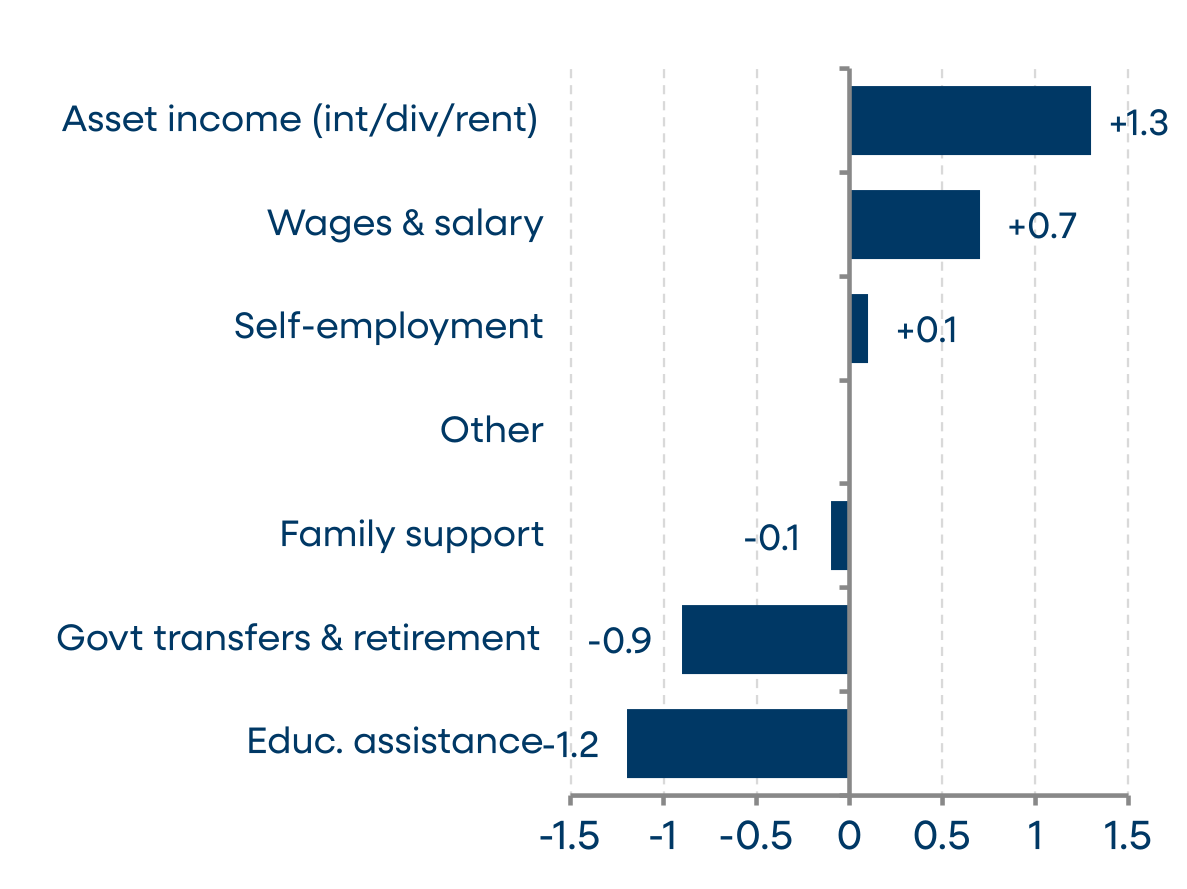
The composition of income is broadly similar as well, with wages and salaries making up roughly 88% of aggregate income for both generations. On the margin, however, Gen Z draws somewhat more income from their asset holdings (e.g. interest, dividends, and rental income) and somewhat less from government and educational assistance.
Figure 6: Share of aggregate income by sources, ages 19-27, Gen Z versus Millennials at same age
Source: Census Bureau CPS ASEC microdata
Note: Ages 19–27 in '15 & '25; components sum to ~100% of total money income
Figure 7: Change in share of aggregate income by source, Millennials -> Gen Z (pp)
Source: Census Bureau CPS ASEC microdata
Note: Ages 19–27 in '15 & '25
Gen Z spends a larger percentage of their paychecks each month, carrying smaller savings buffers in their checking accounts
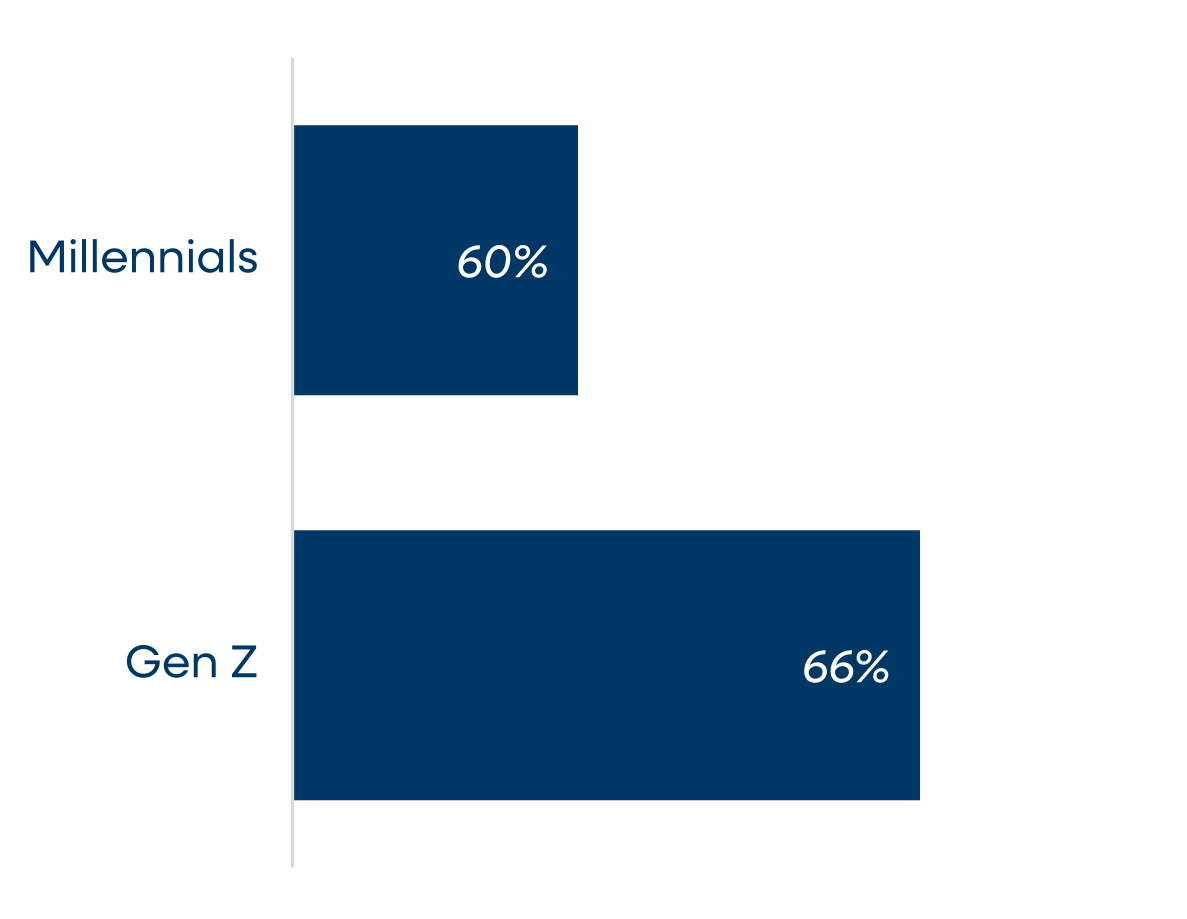
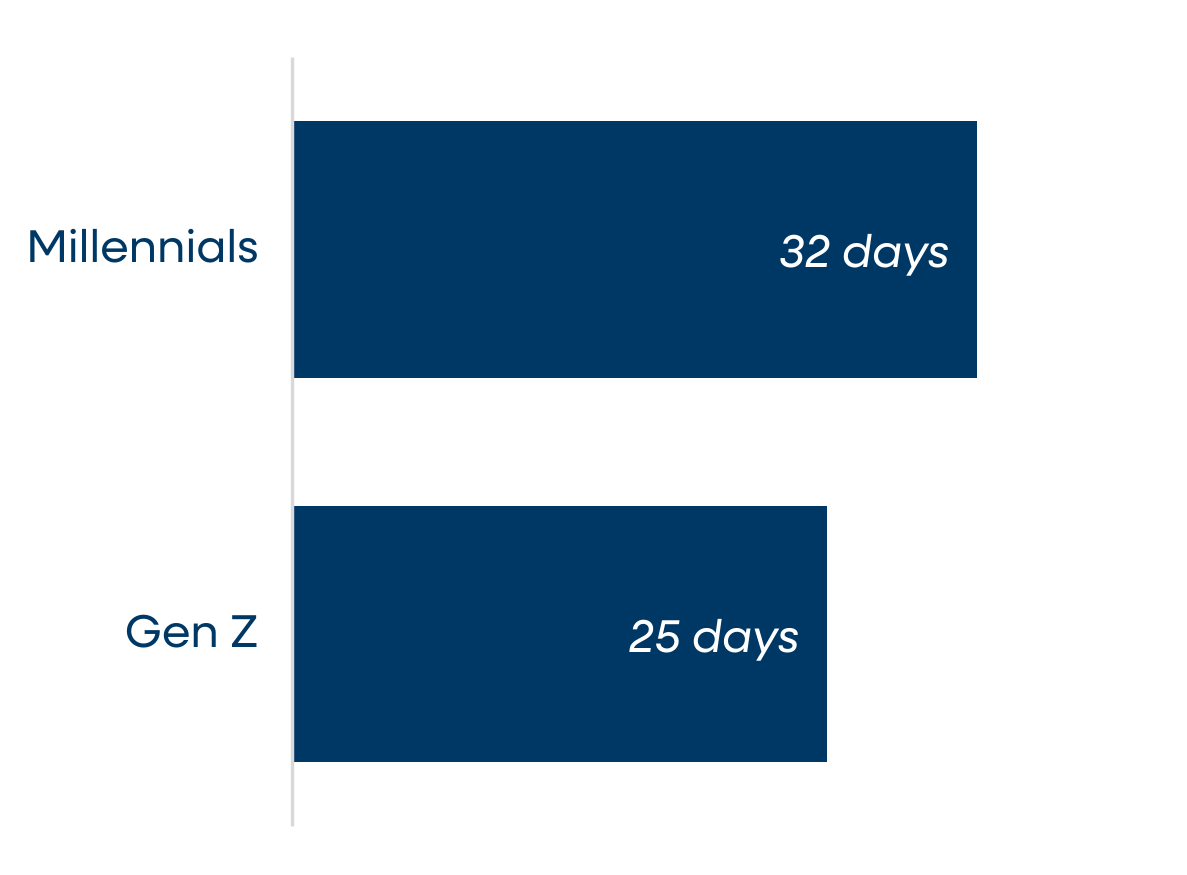
Turning to spending, internal PNC data show that Gen Z tends to spend a larger percentage of their paychecks each month and generally carries smaller buffers in their checking and savings accounts. Gen Z on average spends roughly 66% of their paychecks (including debit card spending and credit card payments), compared with 60% for Millennials at a similar age. Likewise, the typical Gen Z household holds enough in their checking and savings accounts to cover 25 days of spending if their income were to suddenly stop. That compares with 32 days for Millennials.
Figure 8: Average spending as a % of total income
Source: PNC internal data
Note: Gen Z = Sep 2025-Aug 2026; Millennials = Sep 2015-Aug 2016
Figure 9: Savings buffer days
Source: PNC internal data
Note: Chart shows how many days a household could continue spending if income stopped suddenly
This does not mean that Gen Z isn't saving for retirement, however. As we discuss in more depth below, a higher percentage of Gen Z households have a retirement account, and stronger income growth early in their careers has helped them get an earlier start on saving for retirement.
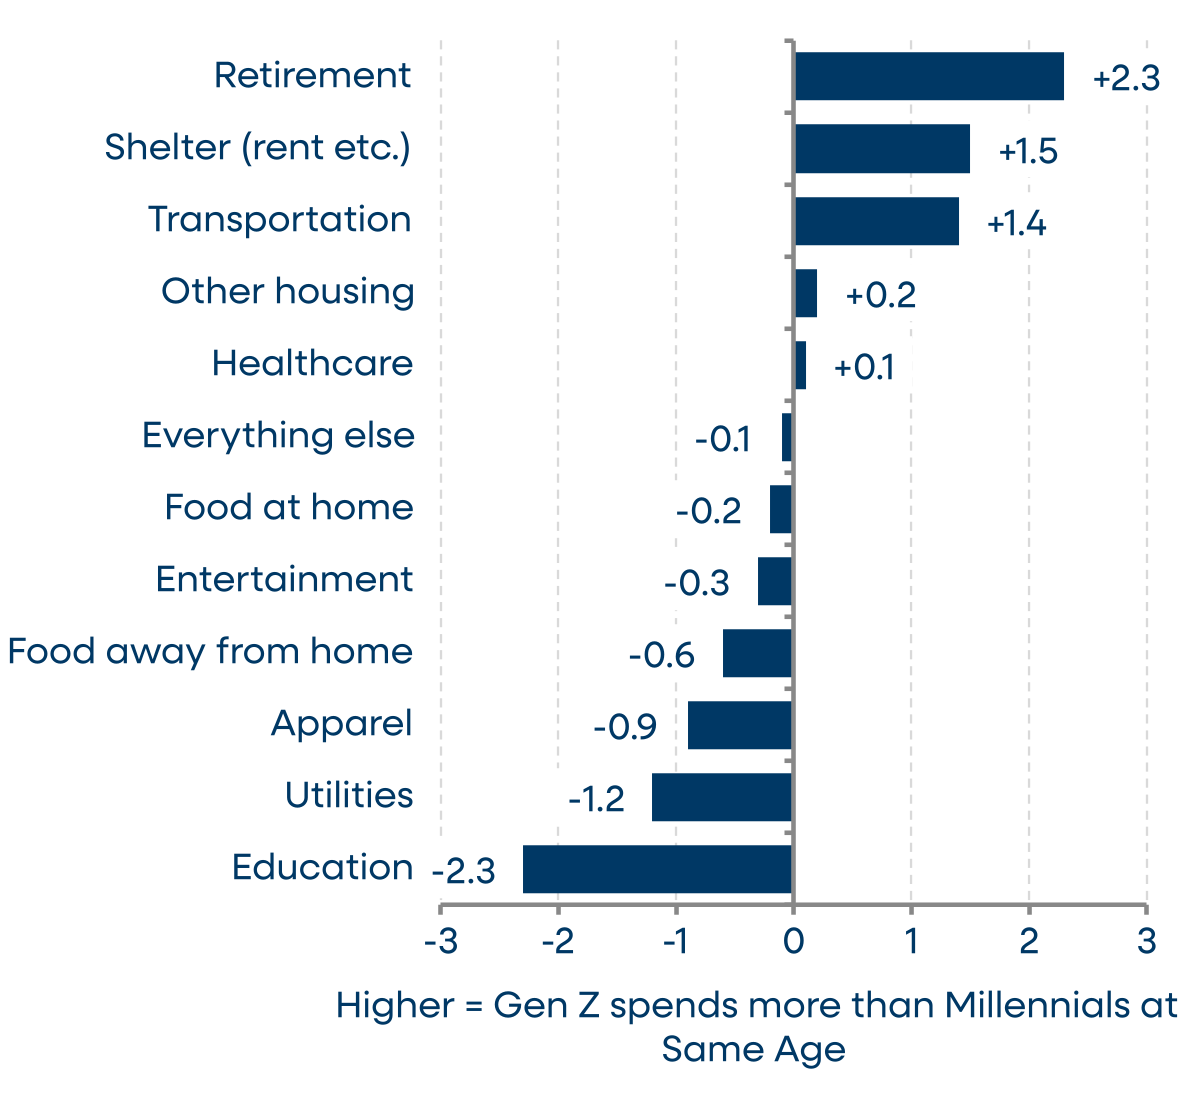
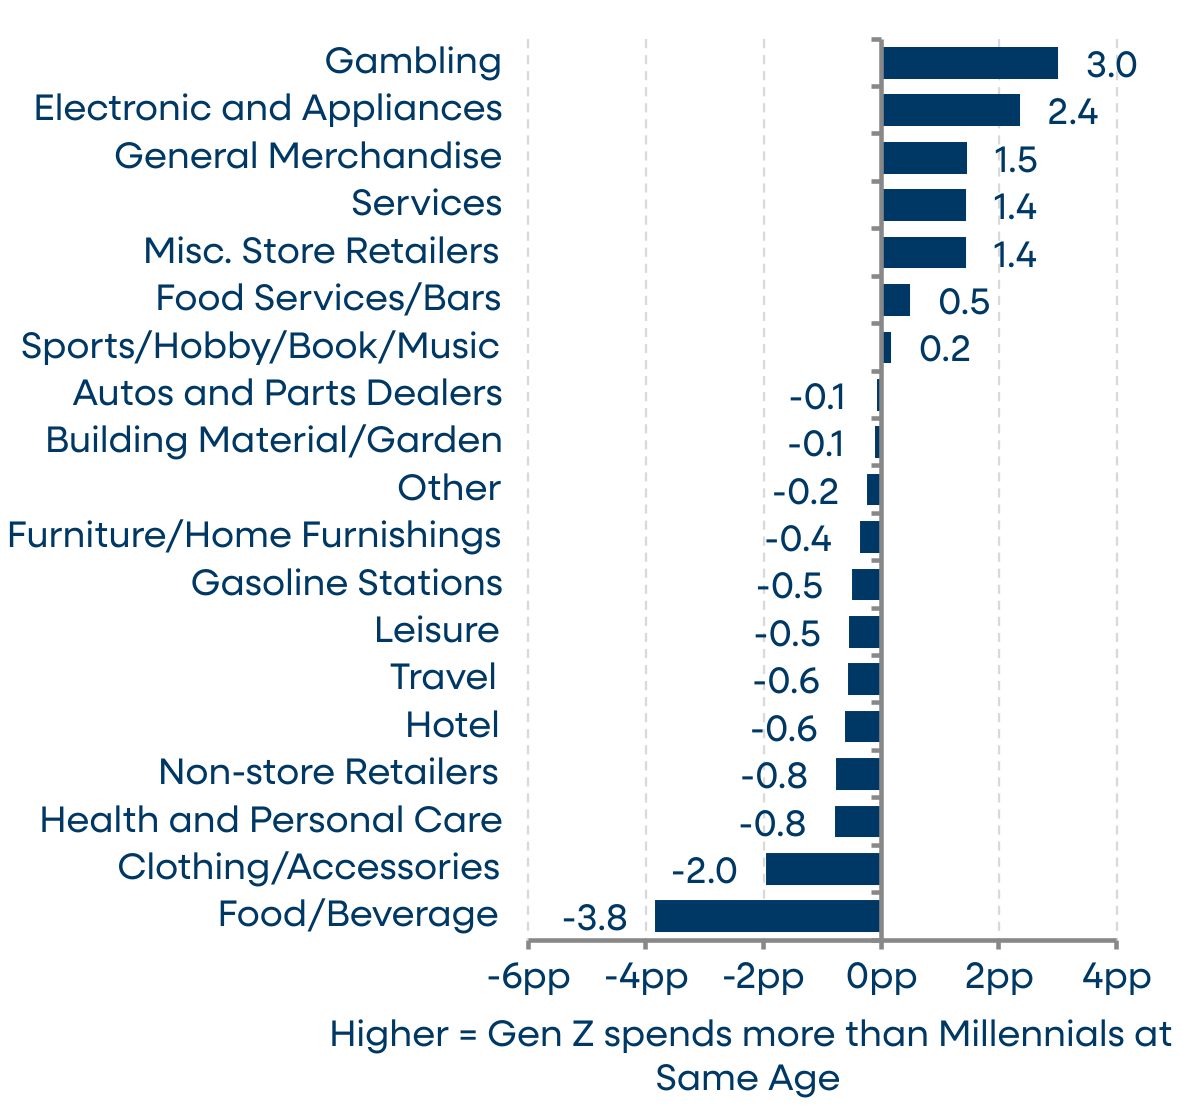
What about the composition of spending? Given the surge in rent and housing costs, Gen Z spends a disproportionate share of their budget on housing each month relative to Millennials. In terms of discretionary spending, Gen Z is also putting a larger share toward gambling and less toward clothing and groceries.
Figure 10: Change in spending shares, under-25 households, Gen Z versus Millennials (pp)
Source: BLS Consumer Expenditure Surveys, under-25 tables; two-year averages
Figure 11: Change in total card share by category, excluding fund transfers
Source: PNC internal data
A stronger labor market for Gen Z on just about every margin
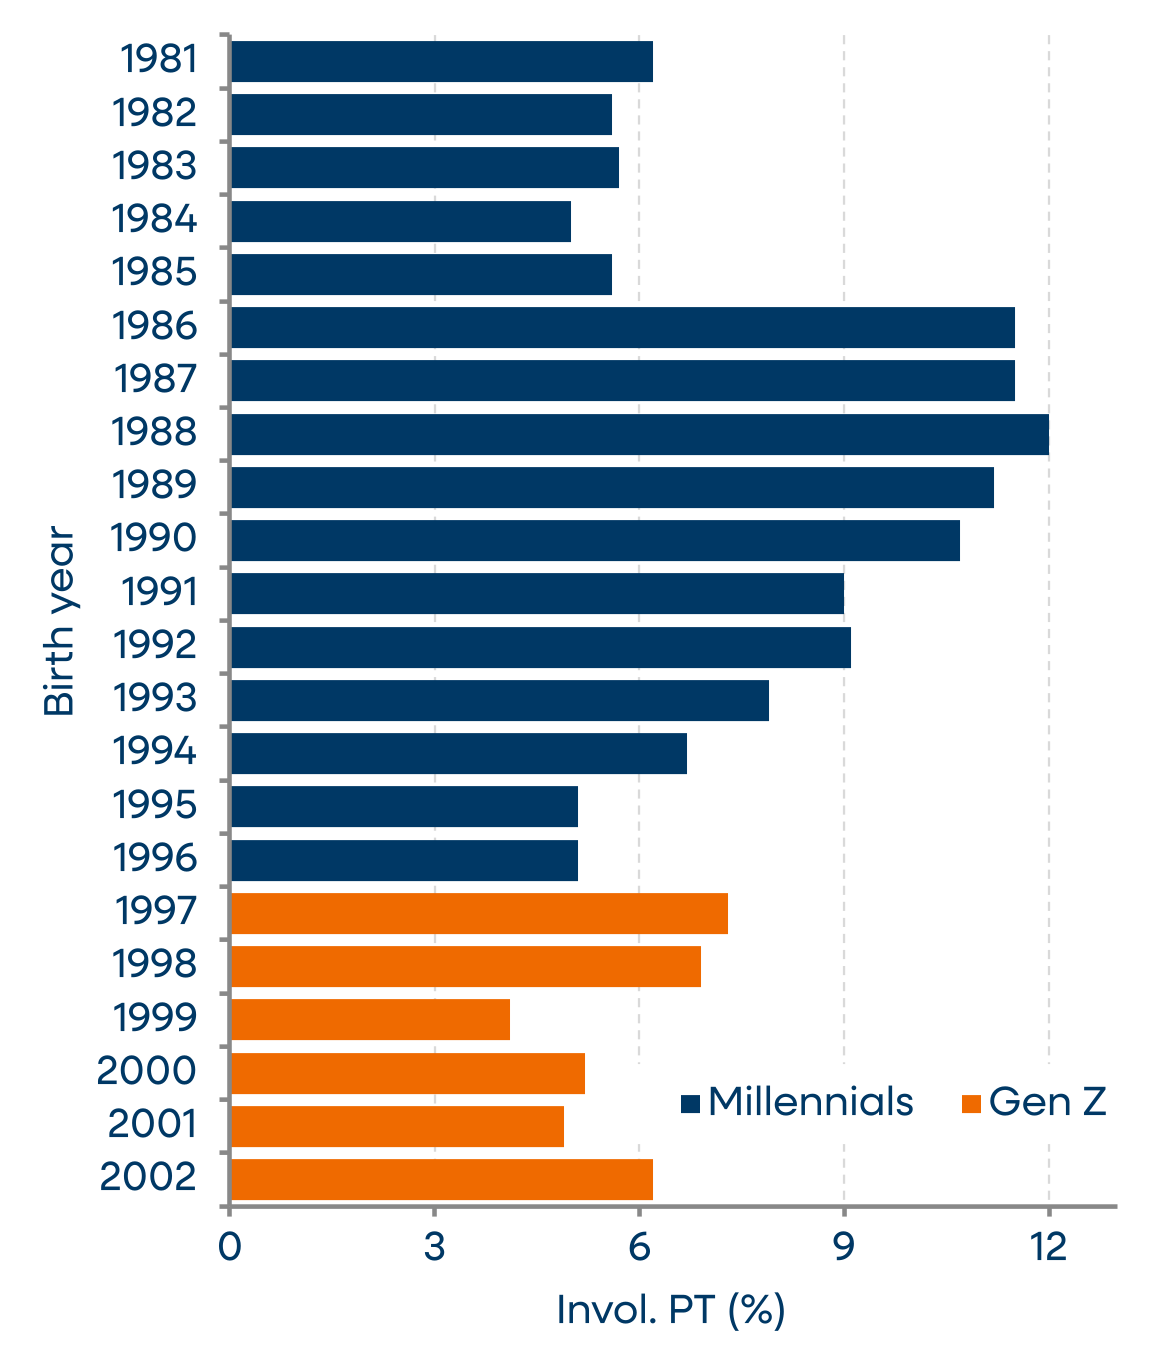
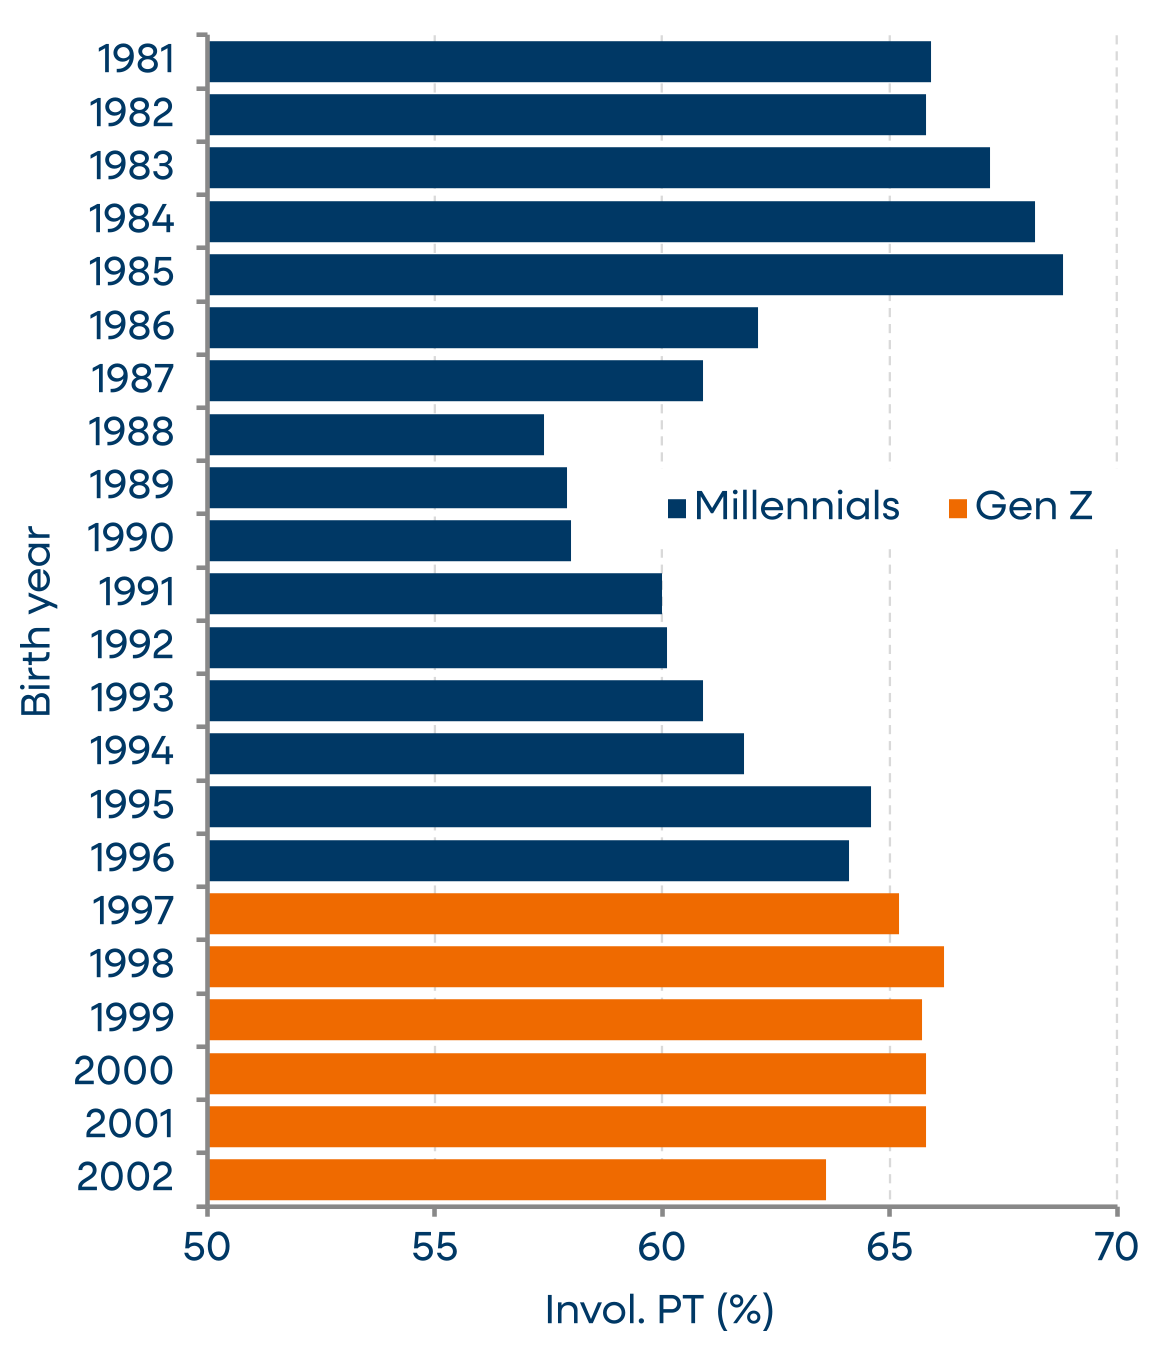
Gen Z entered adulthood in a much stronger labor market than Millennials. Employment and labor-force participation are higher, full-time work is more common, and both unemployment and involuntary part-time work are lower. Millennials, by contrast, began their careers while the labor market was still recovering from the financial crisis, with weaker job availability and greater marginal attachment to work.
Table 1: Gen Z leads on nearly every labor-market indicator (ages 19-27 in 2015 & 2025)
Indicator | Millennials | Gen Z | Difference | Better off? |
|---|---|---|---|---|
Employment-population ratio (%) | 63.6 | 67.2 | +3.6 | Gen Z |
Labor force participation (%) | 70.5 | 72.5 | +2.0 | Gen Z |
Unemployment rate (%) | 9.8 | 7.3 | −2.5 | Gen Z |
Full-time share of employed (usual hrs ≥35, %) | 63.4 | 67.4 | +4.0 | Gen Z |
Involuntary part-time (% of employed) | 7.7 | 5.2 | −2.5 | Gen Z |
Self-employed (% of employed) | 2.9 | 3.3 | +0.4 | Gen Z |
Worked at all in 2014 / 2024 (%) | 71.6 | 74.7 | +3.1 | Gen Z |
Full-year workers, 2014 / 2024 (% of workers) | 66.1 | 68.6 | +2.4 | Gen Z |
Enrolled in school (ages 19–24, %) | 41.9 | 41.3 | −0.6 | N.A. |
NEET: not employed, not enrolled (ages 19–24, %) | 18.0 | 15.4 | −2.6 | Gen Z |
Median usual weekly hours (employed) | 40 | 40 | 0 | Tie |
Source: Census Bureau CPS ASEC microdata
Note: Ages 19–27 in '15 & '25
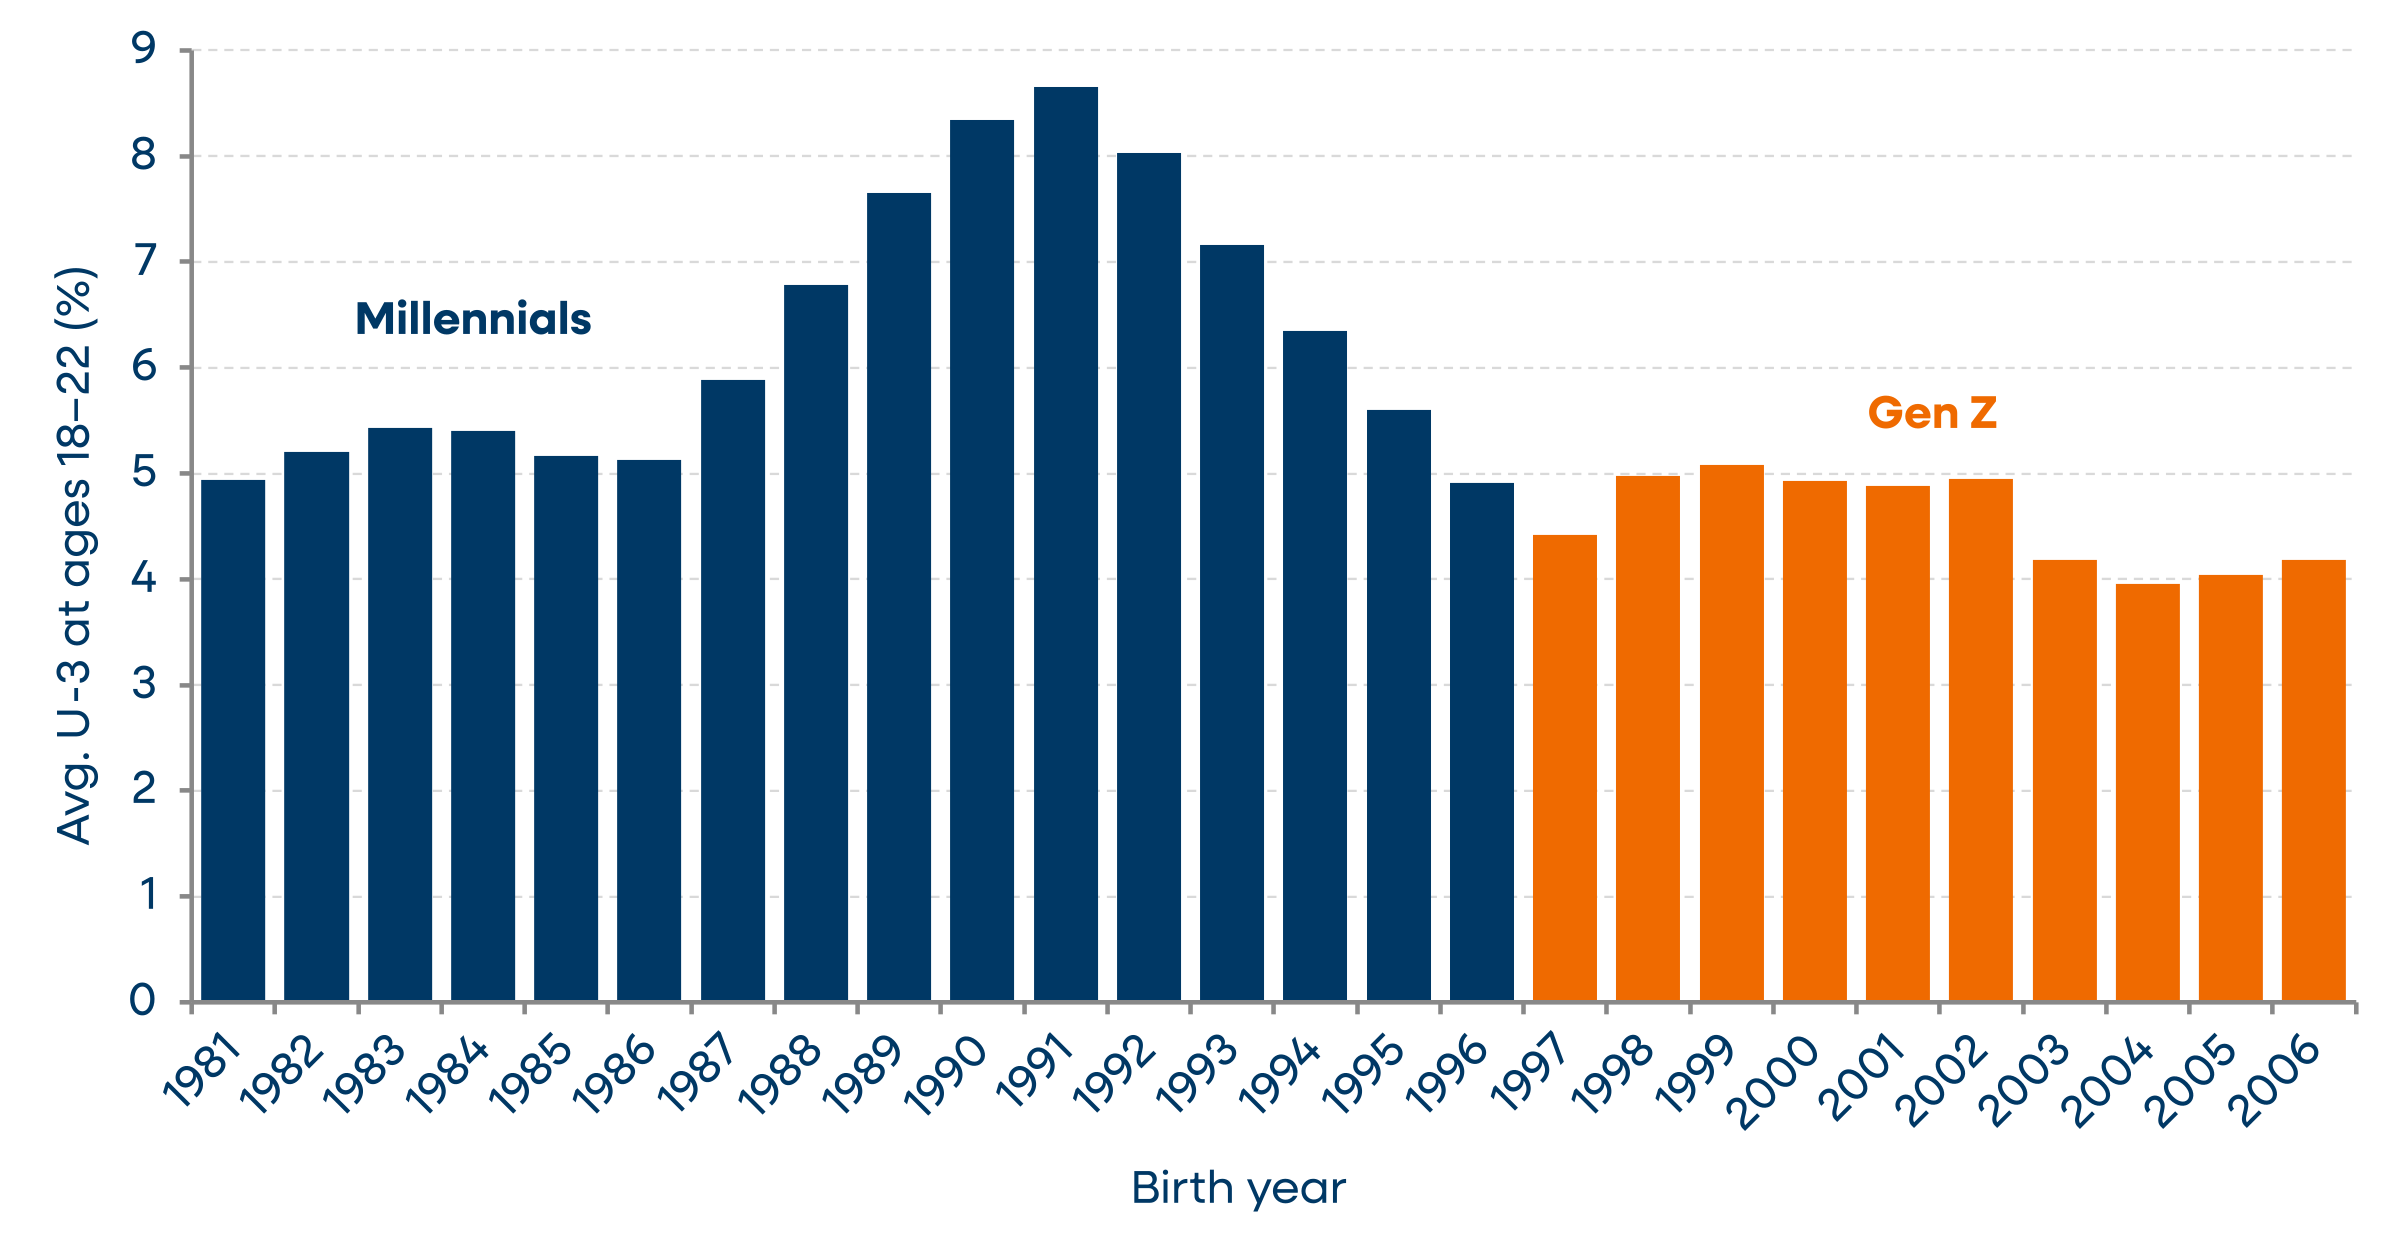
That isn't to say that Gen Z isn't facing its own set of labor market challenges. There is growing evidence that work-from-home has been a negative for younger workers, and AI appears to be disproportionately affecting younger workers in AI-exposed fields. Still, the 18-22 year-old unemployment rate has remained near the lower-end of what we saw during the entirety of the 2010s since 2021.
Figure 12: Average unemployment rate faced at ages 18–22 by Birth Year (%)
Source: BLS, partial averages for years 2003 to 2006
Figure 13: Involuntary part-time at 22–23 by Birth Year (% of employed)
Source: BLS
Figure 14: Full-time share of employed at 22–23 by Birth Year (usual hrs ≥35, %)
Source: BLS
Gen Z ahead on wealth at the same age
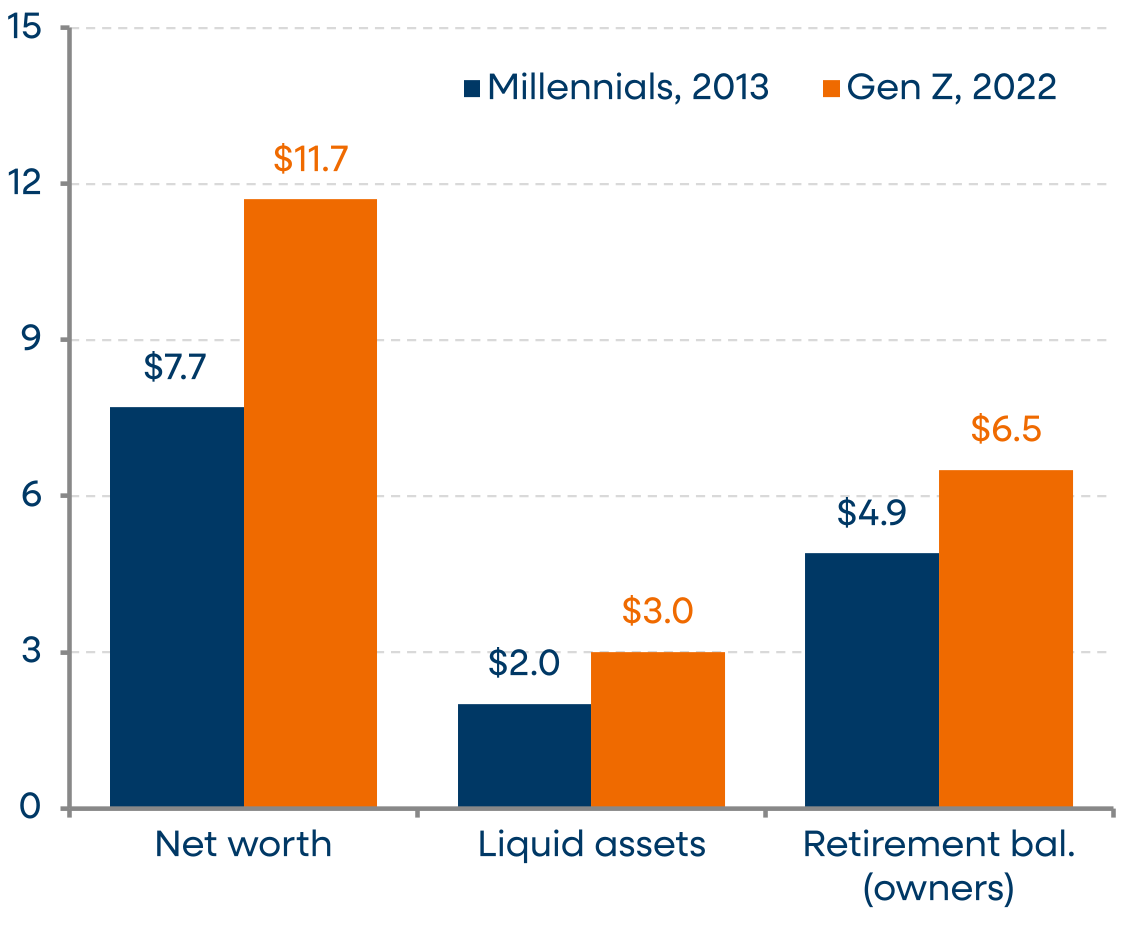
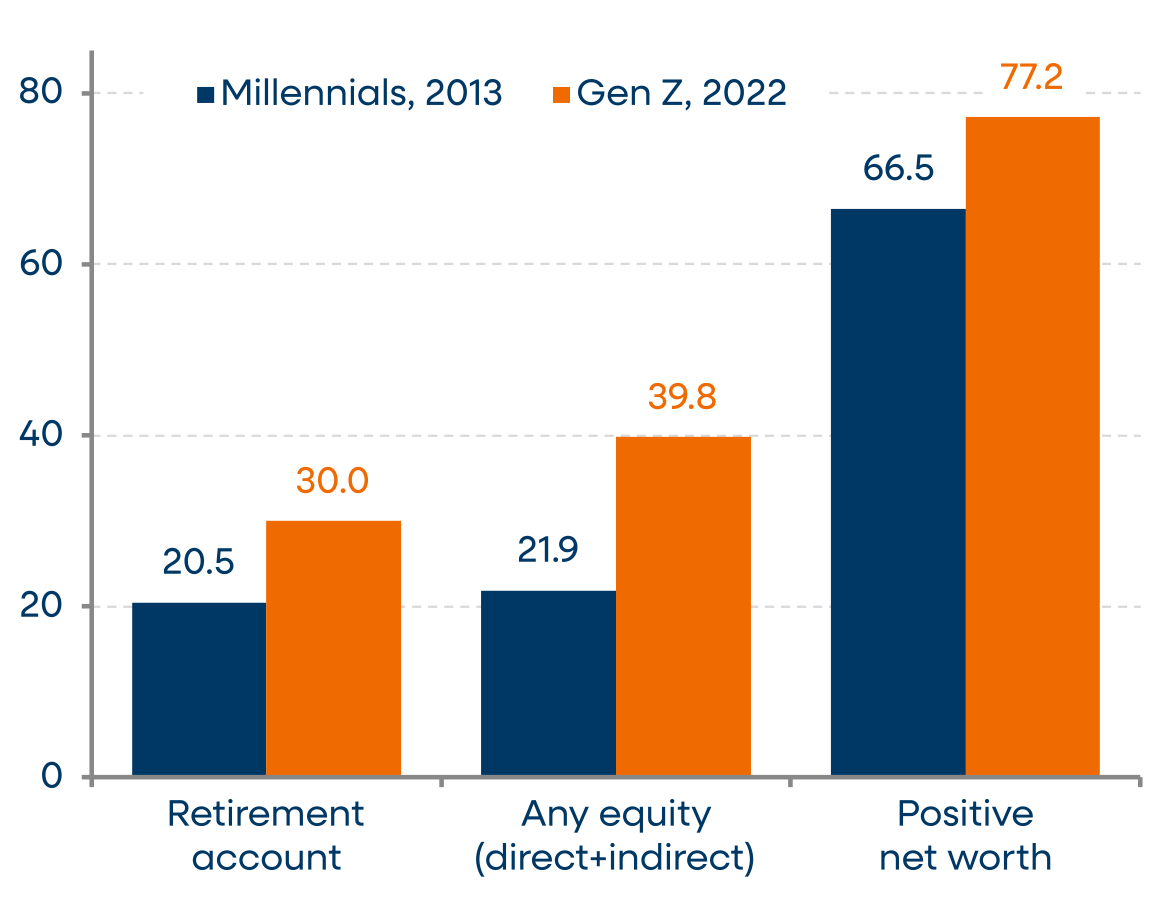
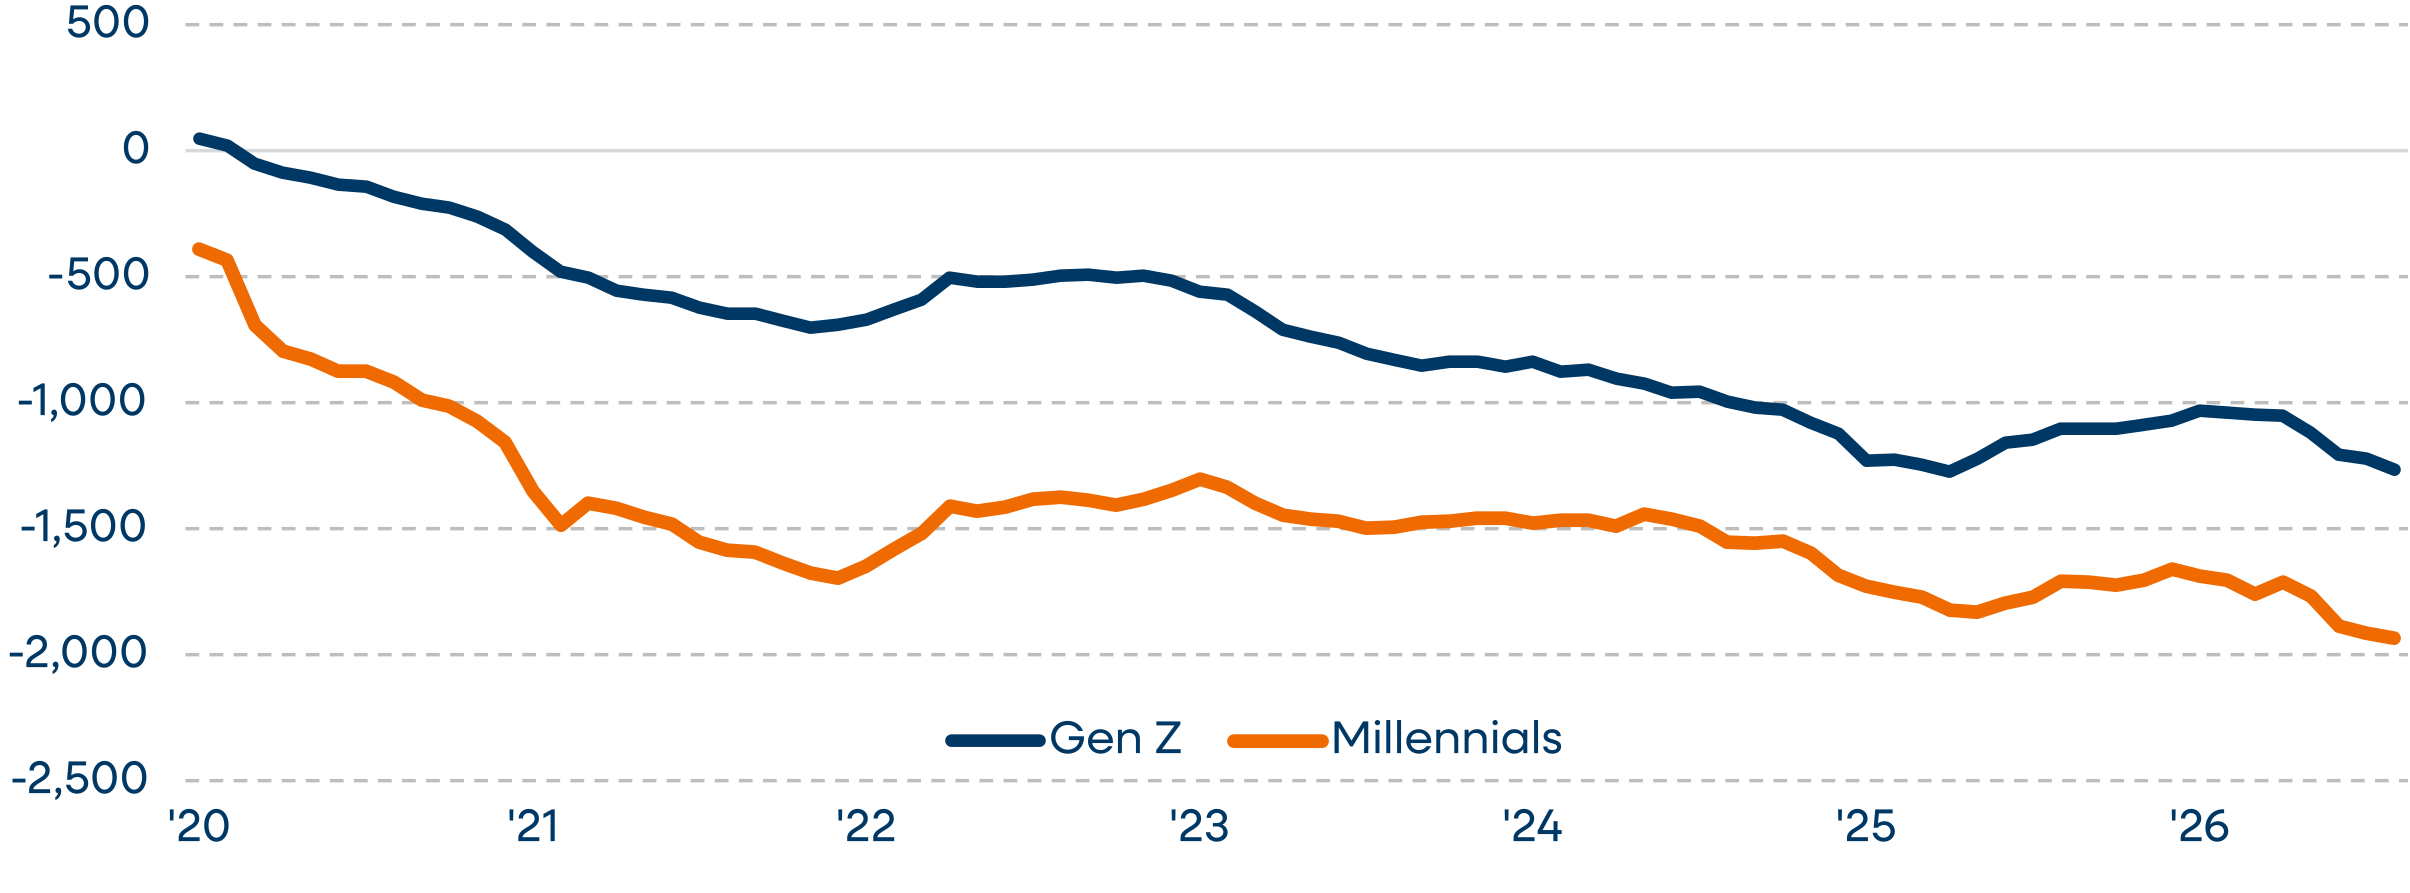
Stronger employment and income growth have translated into healthier balance sheets for Gen Z early in their careers. The typical Gen Z household has a higher net worth, is more likely to hold a retirement account, and is more likely to have a positive rather than negative net worth. Though government data on net worth by generation are fairly lagged (the latest Survey of Consumer Finances is from 2022), internal PNC checking account data show that Gen Z is generally more apt to move income into investment or brokerage accounts than Millennials were at a similar age. In fact, net outflows from checking accounts into brokerages for Gen Z households have generally been catching up to Millennials in recent years (see Figure 17).
Figure 15: Median Net Worth (2025$, thousands)
Source: FRB SCF 2013 & 2022, deflated with PCE
Figure 16: Percent households with…
Source: FRB SCF 2013 & 2022, deflated with PCE
Figure 17: Net outflows from checking accounts into investment accounts, cumulative 12M trailing sum
Source: PNC internal data
Note: Chart shows the cumulative 12M net inflows from brokerage/investment accounts into checking accounts
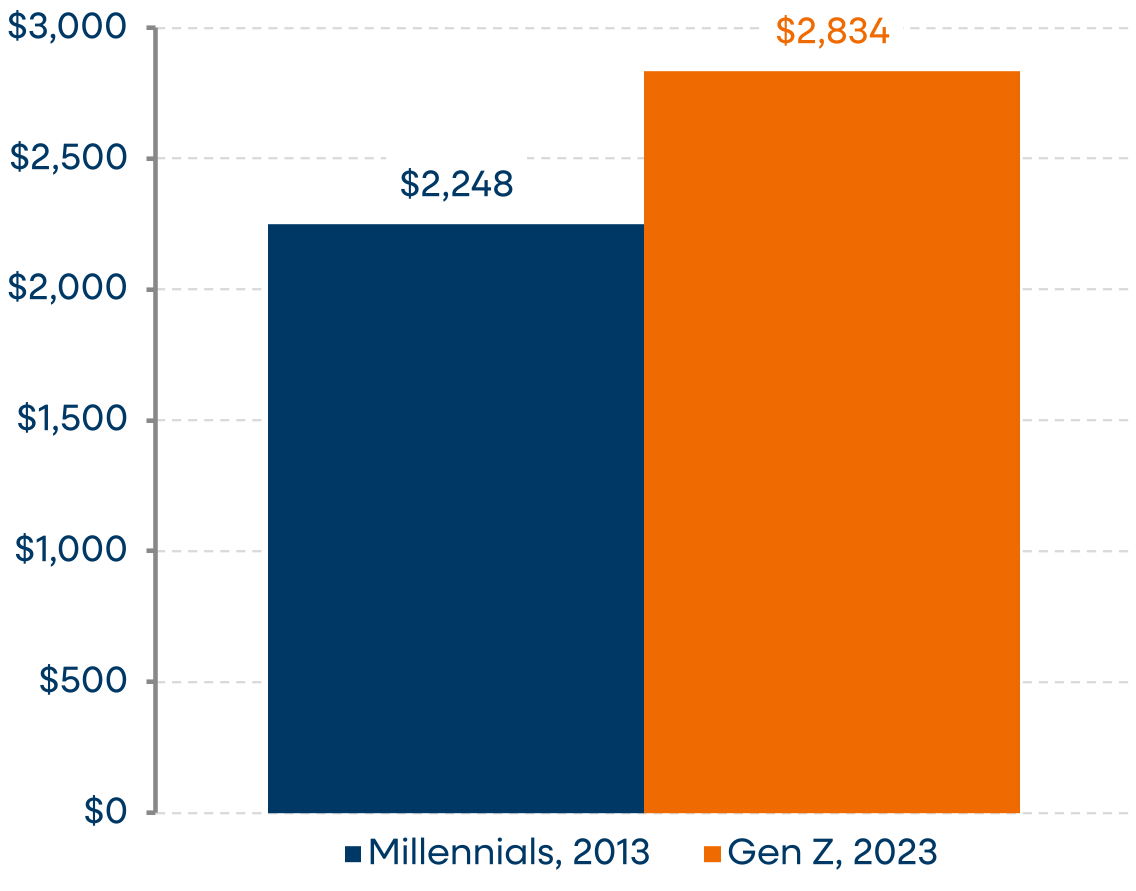
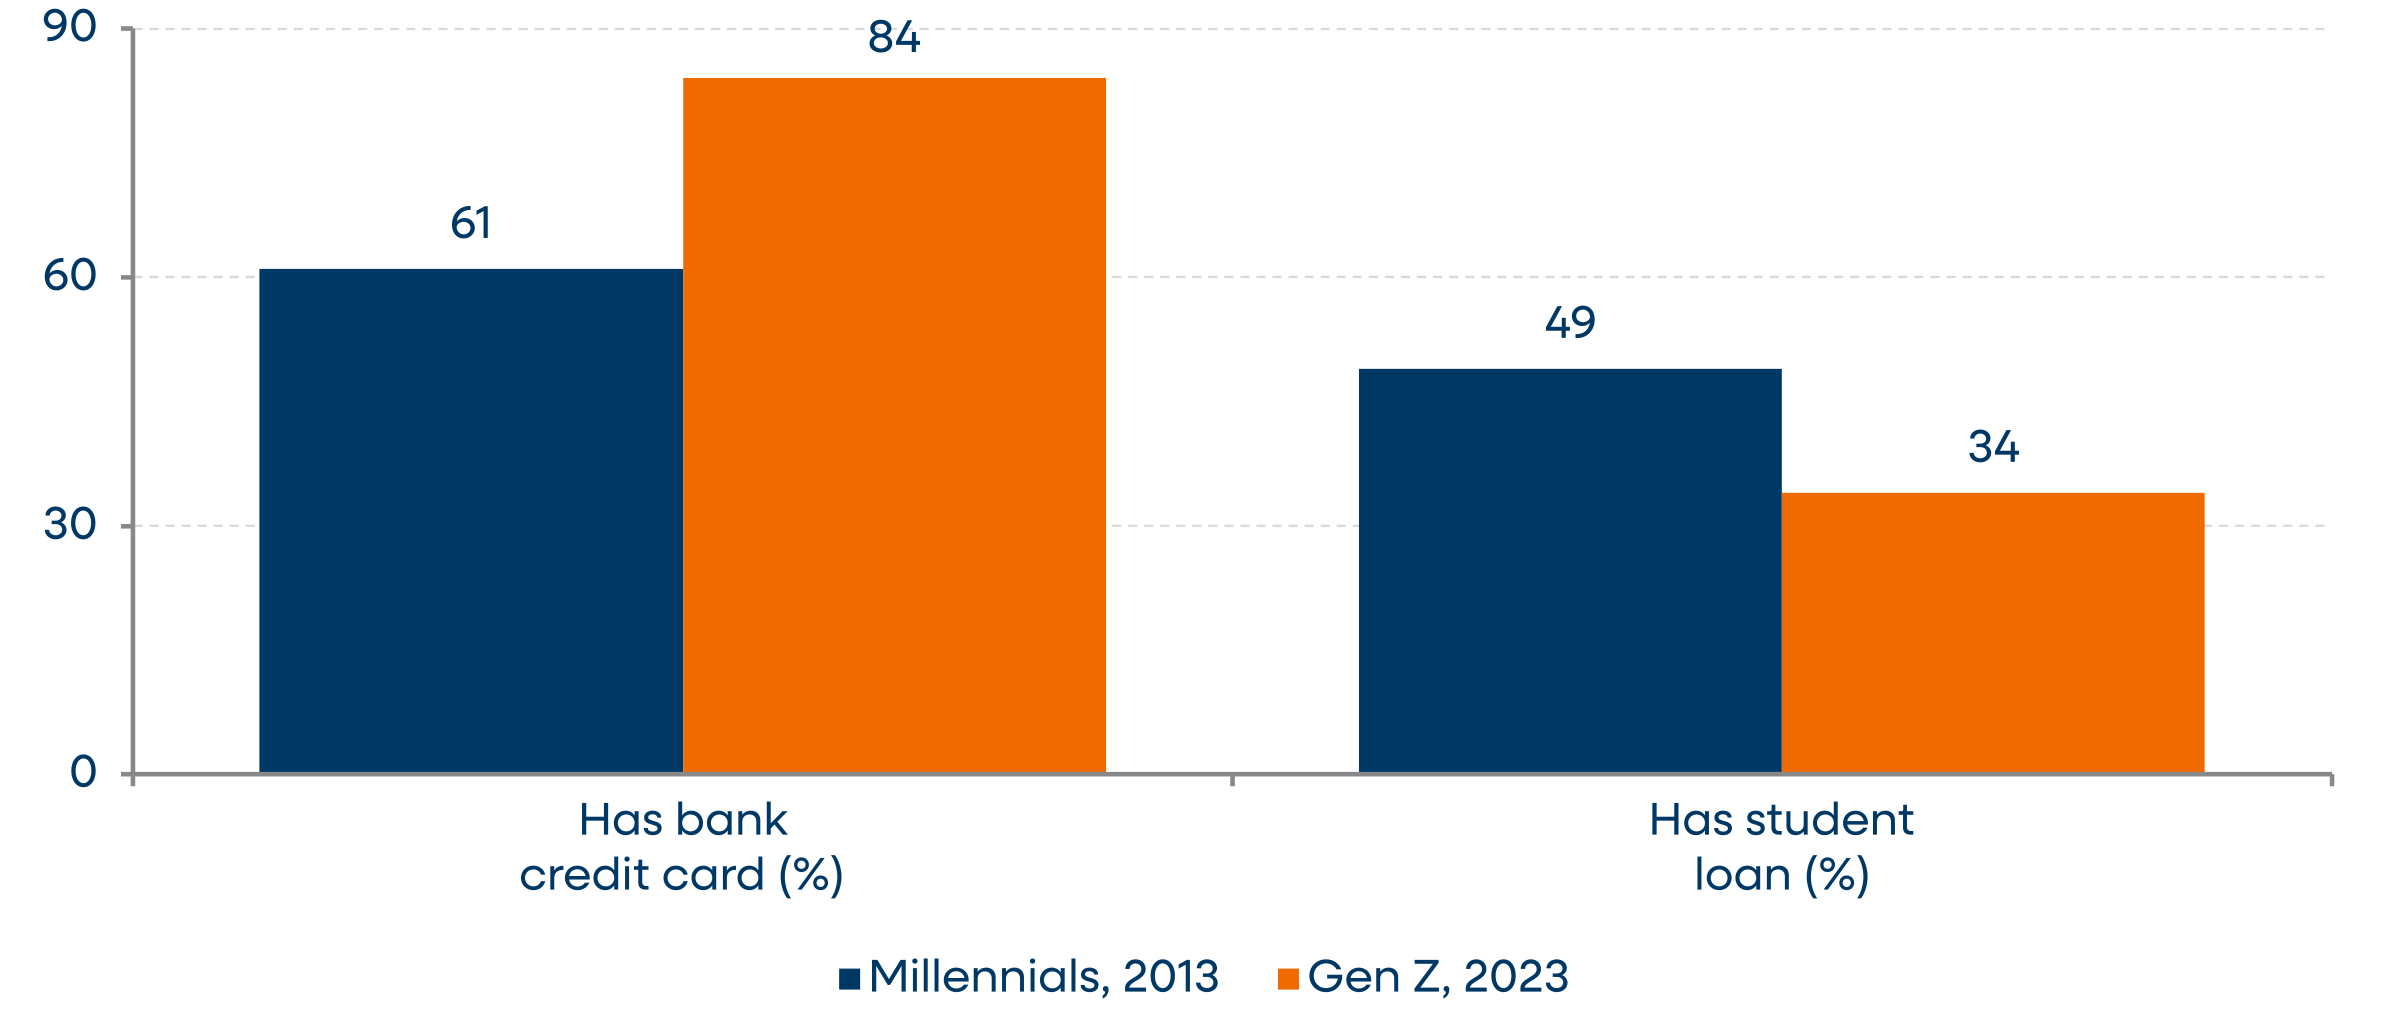
In terms of debt, Gen Z tends to use credit more broadly than Millennials did at a similar age, and affordability challenges and inflation have led to higher credit balances. According to TransUnion, the average credit card balance per consumer was $2,834 for Gen Z in 2023, versus an inflation-adjusted $2,248 for Millennials ten years earlier, a roughly 26% increase.
However, as discussed earlier, this increase in credit card balances is on par with, if not slightly less than, the increase in real incomes over the same period. We see little evidence that Gen Z is overusing credit cards or falling behind on payments in a way that would raise concerns about their overall balance sheet health.
Figure 18: Average credit card balances, inflation adjusted
Source: TransUnion
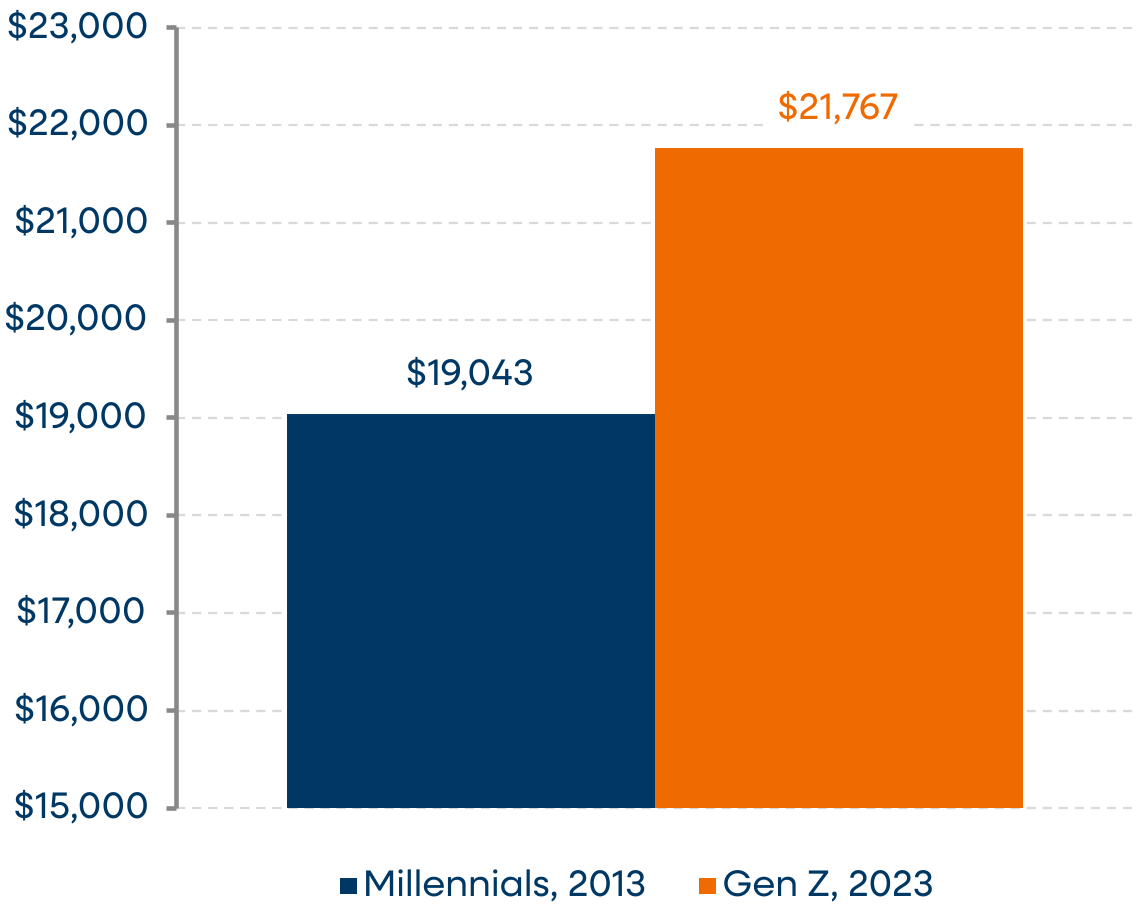
Figure 19: Average auto loan balances, inflation adjusted
Source: TransUnion
Figure 20: Credit-bureau records at ages 22-24
Source: CFPB Consumer Credit Trends
Housing and affordability challenges are the major exception to Gen Z’s stronger financial position
The main exception to Gen Z's advantage has been the stark deterioration in affordability and persistently high inflation, something Millennials did not have to deal with early in their careers. Despite higher real incomes, Gen Z is no more likely to own a home, just as likely to live with their parents, and devotes a larger share of spending to rent or mortgage payments. Prices overall have risen nearly 31% since 2019, and house prices are up more than 60%. For many Gen Z households, owning a home feels out of reach, and the housing math supports that view. The mortgage payment on a median-priced home takes up over 65% of the median income of a 25- to 26-year-old today, versus just 39% for Millennials at the same age.
Figure 21: Percent of median income that would be required to pay the mortgage on a median-priced home
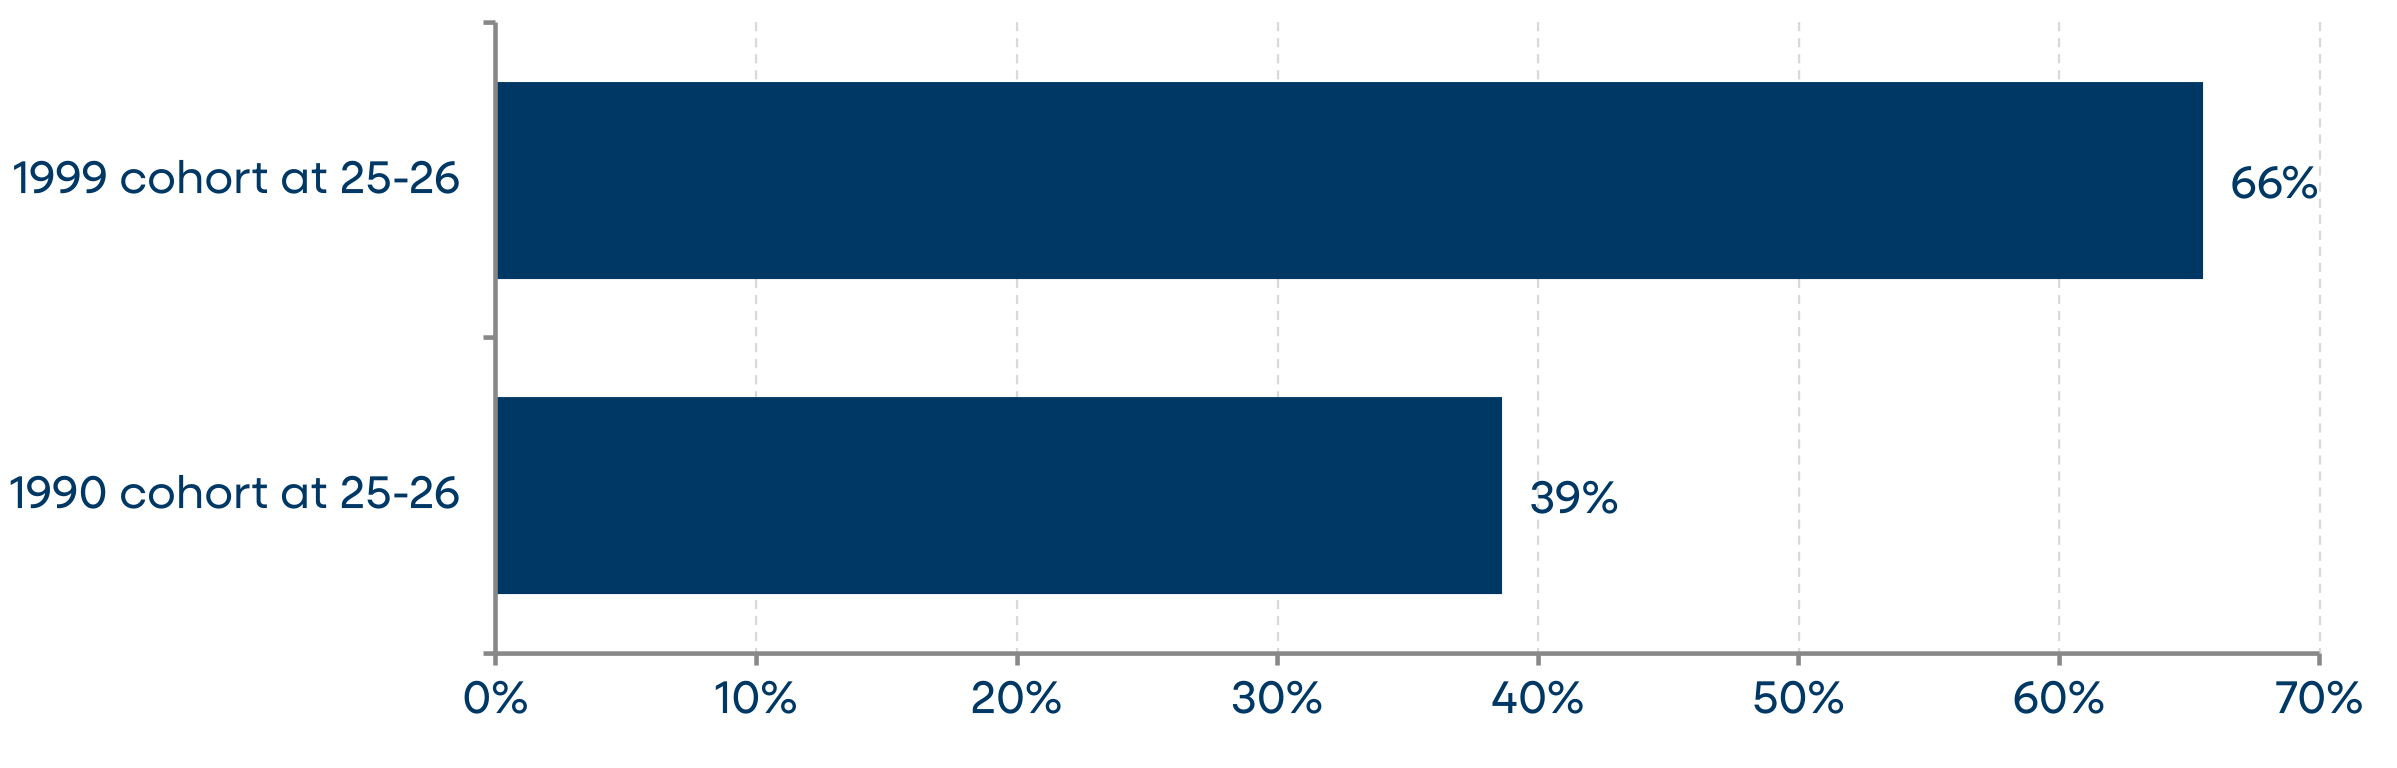
Source: Census/HUD new-home price and Freddie Mac 30-yr rate via FRED; Census ASEC cohort incomes:
Figure 22: Homeowner at 25–26 (%)
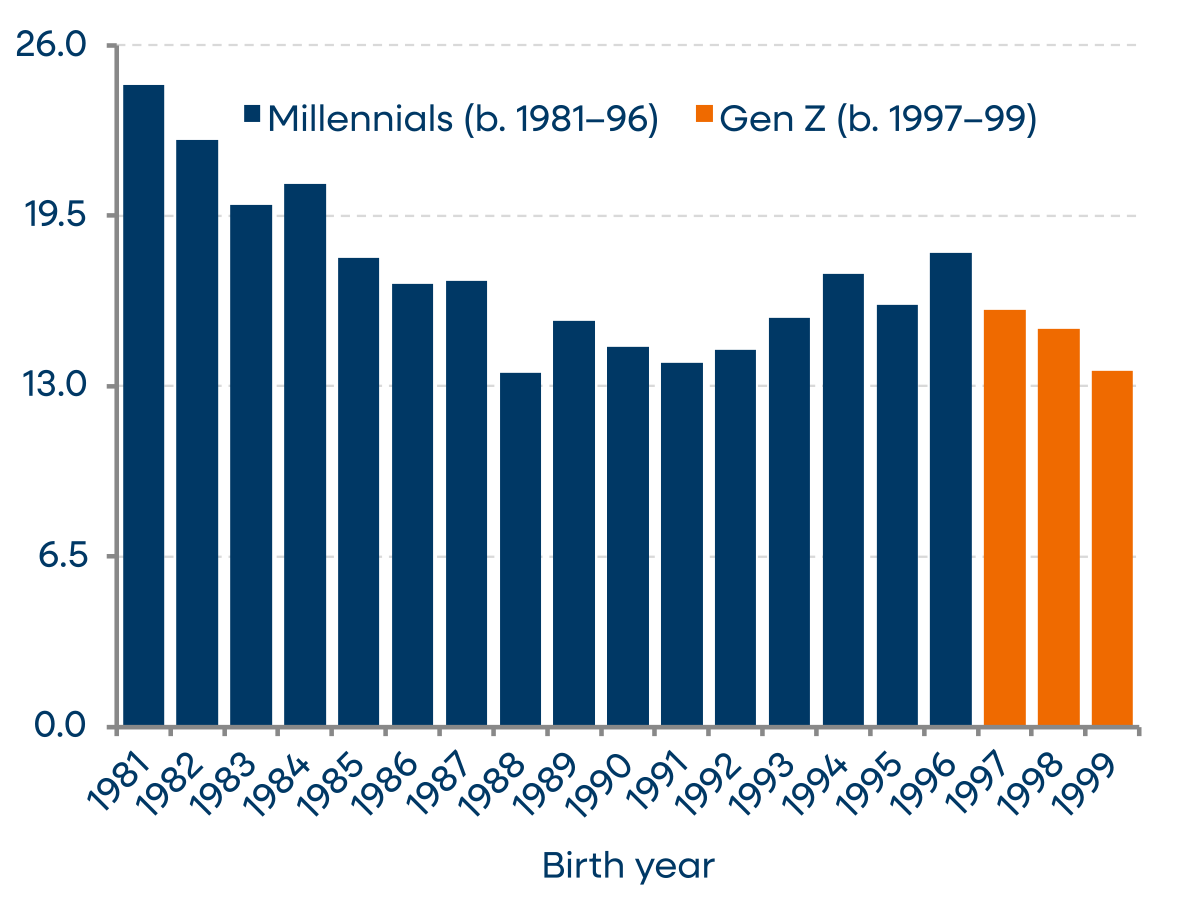
Source: Census CPS ASEC microdata, ages 25–26
Figure 23: Living with parents at 25–26 (%)
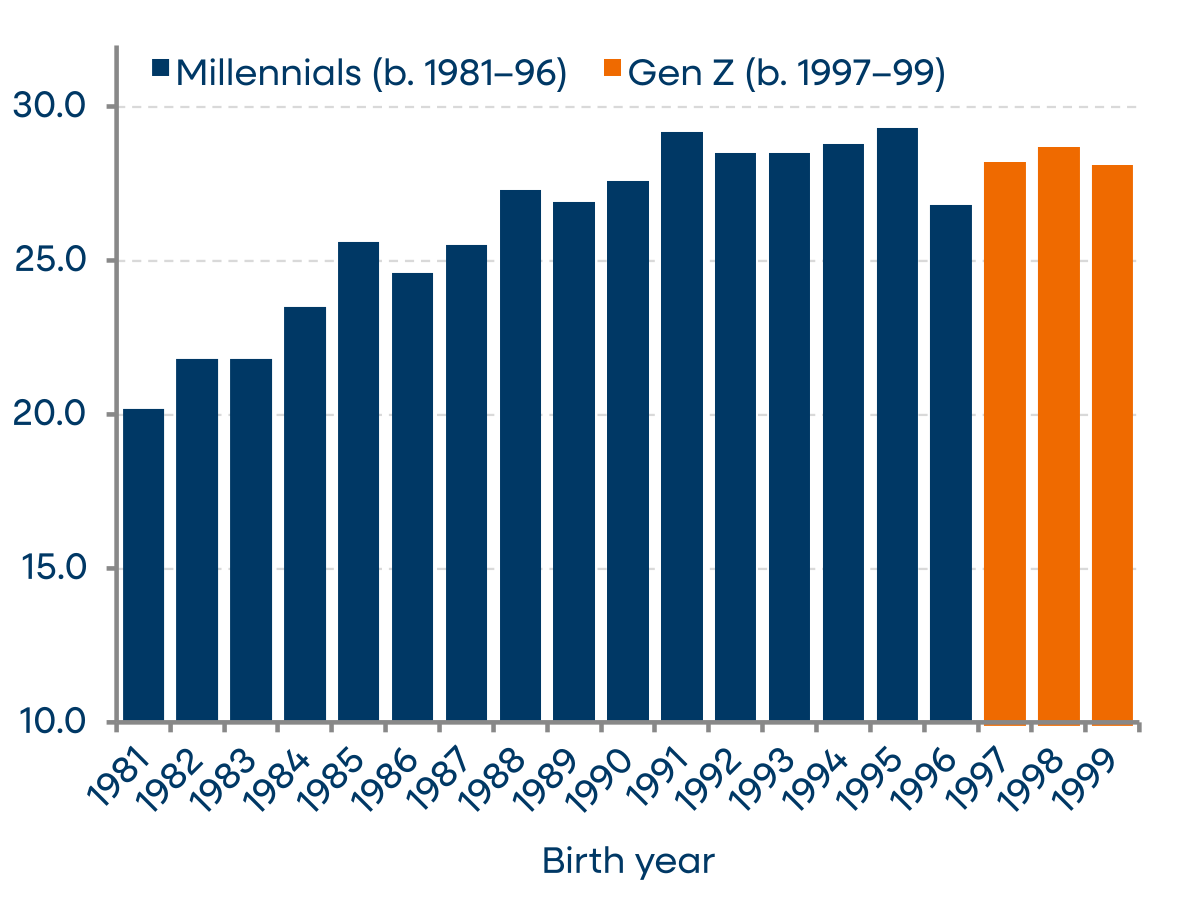
Source: Census CPS ASEC microdata, ages 25–26
No more “Millennial optimism”: the youth optimism premium has disappeared with Gen Z
Despite earning more, entering a stronger labor market, and having relatively healthier balance sheets overall, Gen Z feels significantly worse about its finances than Millennials did at a similar age. In our view, the root cause is what we discussed in the previous section: persistently high inflation and a significant deterioration in affordability have weighed on sentiment, making typical life goals like buying a home seem more out of reach.
In the Fed's SHED survey, a net 17.7% of 19- to 27-year-olds in 2015 said they were better off financially than a year earlier, about double the reading for all adults. By 2025, that figure for the same age group had fallen to −3.1%, barely above the −4.5% reading for all adults. The University of Michigan survey tells a similar story. Sentiment among 18- to 34-year-olds has historically run well above the overall index, but it has been below the overall reading in 18 of the past 20 months. Before 2018, that had never happened (Figure 24). September's reading was more positive for young adults, and we'll be watching whether that marks a turn or a one-off.
Figure 24: Difference Between 18-34yo Consumer Sentiment and Overall Consumer Sentiment
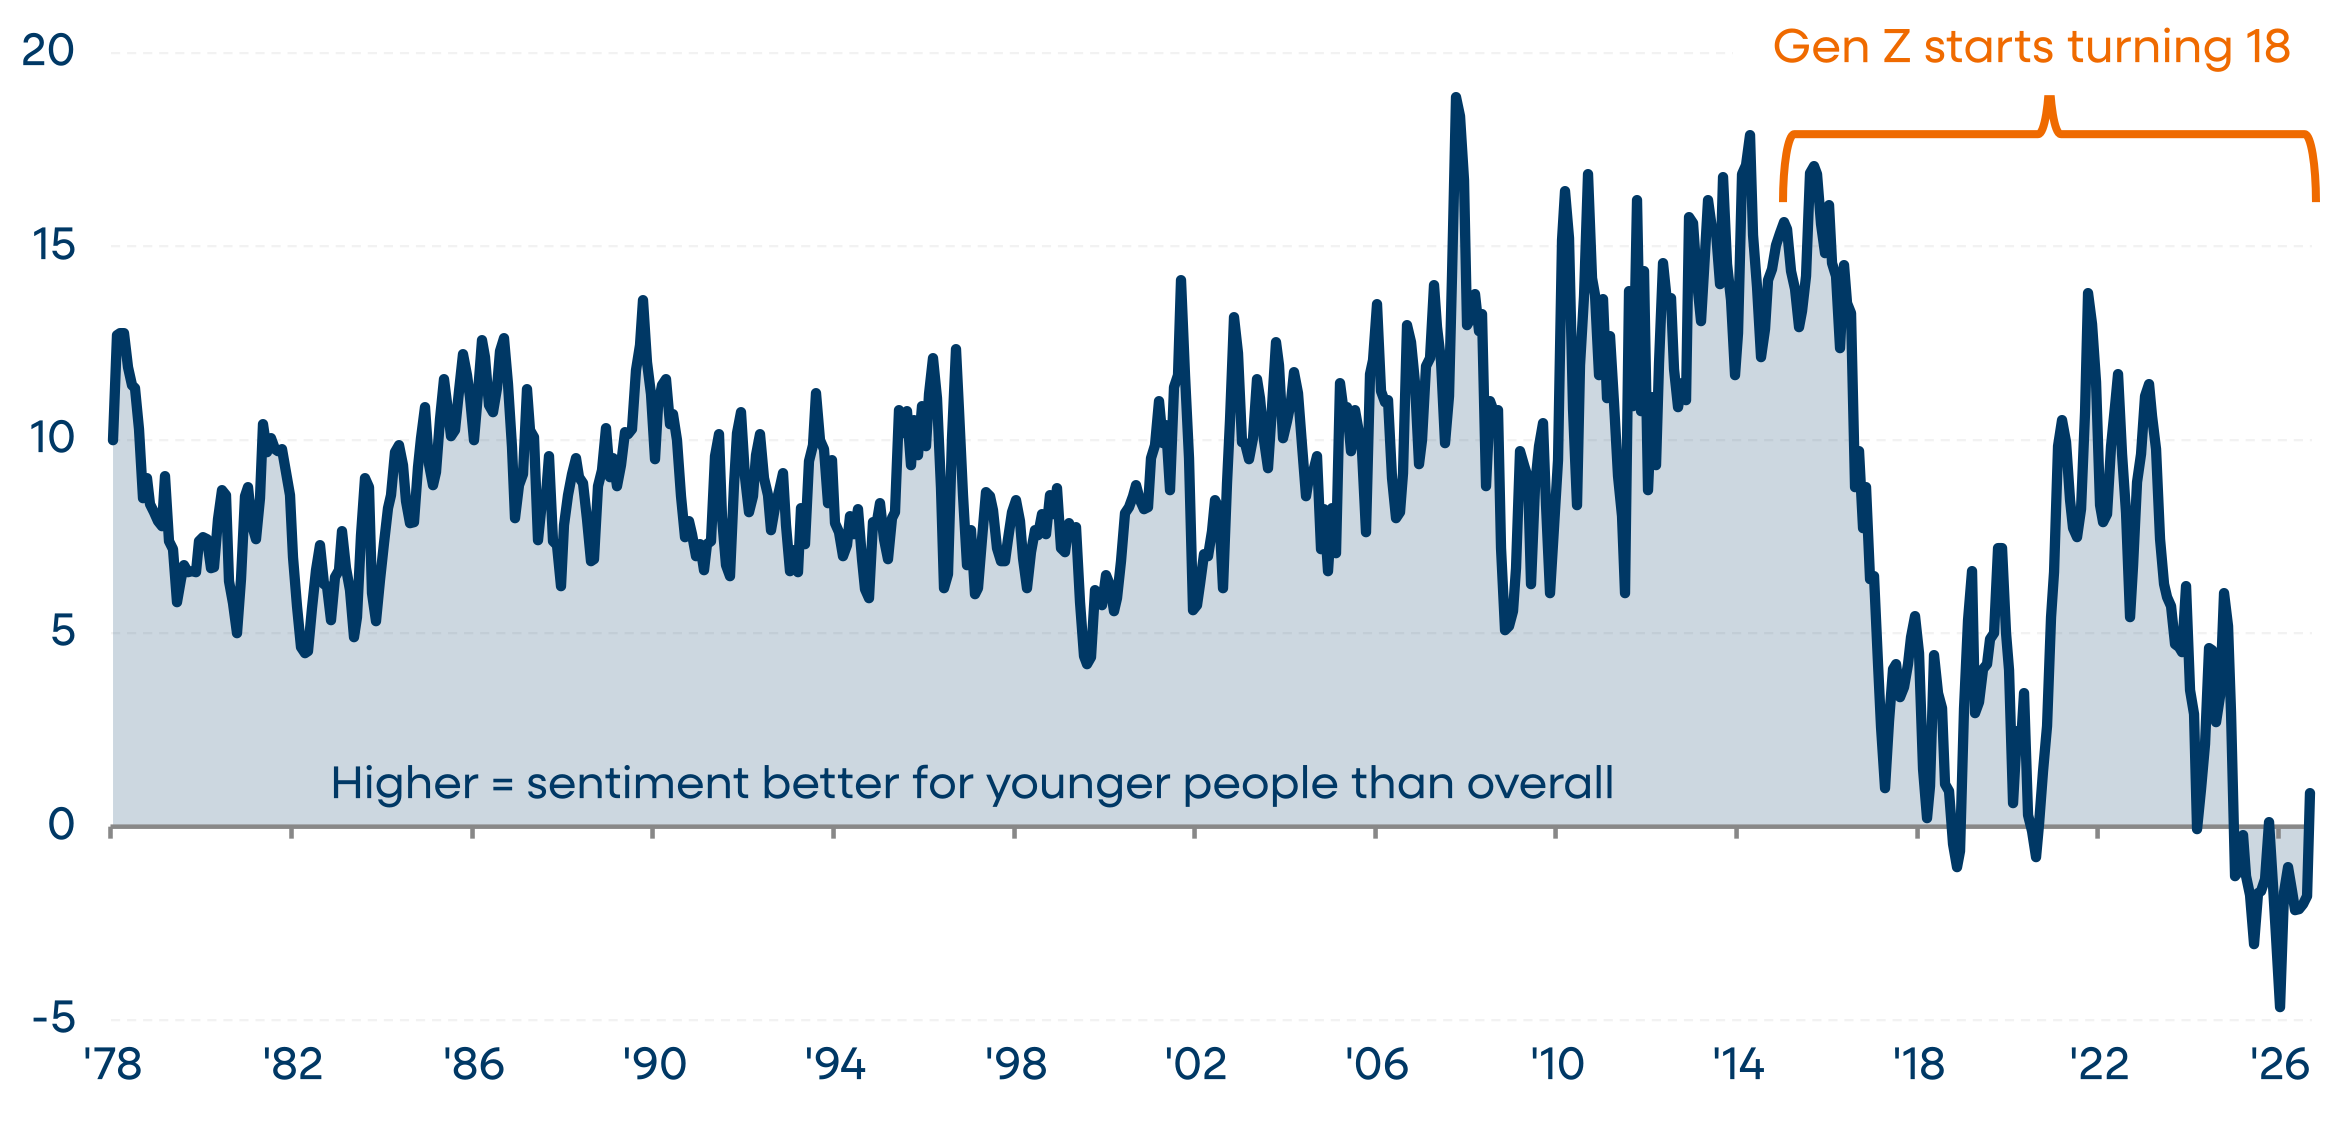
Source: University of Michigan
Key Charts and Figures
Indicator | Dec ‘25 | Jan ‘26 | Feb ‘26 | Mar ‘26 | Apr ‘26 | May ‘26 | Jun ‘26 | Jul ‘26 | Aug ‘26 | Sep ‘26 |
| Key Aggregates | ||||||||||
Total Spending | 2.9% | 4.5% | 5.3% | 5.0% | 6.3% | 6.3% | 6.5% | 6.2% | 3.5% | 6.1% |
Total (Ex. Gas Stations) | 3.3% | 5.2% | 5.9% | 4.5% | 5.6% | 5.1% | 6.0% | 5.7% | 2.9% | 5.1% |
| Sector Level | ||||||||||
Auto | 6.3% | 4.8% | 7.7% | 6.3% | 7.5% | 3.6% | 6.7% | 5.1% | 4.1% | 7.6% |
Restaurants and Bars | -0.1% | 3.5% | 3.9% | 0.4% | 3.0% | 3.5% | 1.4% | 3.6% | -0.0% | 2.5% |
Food/Beverage Stores | -0.2% | 2.9% | 0.4% | -0.8% | -0.1% | 1.1% | -1.4% | 0.4% | -3.7% | -1.2% |
Gambling | 16.6% | 16.6% | 12.9% | 13.3% | 17.8% | 18.1% | 22.5% | 26.6% | 11.1% | 9.9% |
Gas and Service Stations* | -3.6% | -6.0% | -3.2% | 11.9% | 17.0% | 25.1% | 14.3% | 13.7% | 12.7% | 21.2% |
Hotels | -2.6% | 0.2% | 2.3% | -0.1% | 3.4% | 1.3% | -0.9% | 2.7% | 0.4% | 3.9% |
Leisure | -3.4% | 4.1% | 5.0% | 2.7% | 5.6% | 4.3% | 4.9% | 3.5% | 2.6% | 5.5% |
Services | 5.1% | 4.2% | 6.4% | 6.7% | 6.6% | 5.0% | 8.1% | 8.2% | 6.2% | 7.5% |
Travel | 1.9% | 3.3% | 7.5% | 6.7% | 6.8% | 6.4% | 7.4% | 7.6% | 5.9% | 7.1% |
Retail – Building/Garden/Supplies | -5.2% | 0.5% | -3.0% | -0.8% | 5.9% | -0.3% | 2.1% | 1.7% | -1.3% | 3.9% |
Retail – Clothing Accessories | -1.2% | 1.9% | 4.5% | 0.7% | 1.9% | 0.6% | 1.1% | 3.4% | -1.1% | 4.1% |
Retail – Electronics and Appliances | 6.8% | 11.4% | 11.1% | 9.0% | 7.2% | 10.5% | 11.6% | 11.0% | 11.2% | 14.1% |
Retail – Furniture and Home Furnishings | -2.3% | 3.5% | 3.8% | -0.6% | 2.1% | 6.0% | 4.4% | 4.0% | -0.2% | 7.5% |
Retail – General Merchandise Stores | 2.1% | 4.6% | 4.5% | 3.6% | 4.8% | 7.4% | 5.9% | 7.2% | 6.2% | 7.6% |
Retail – Health and Personal Care | -5.5% | -1.2% | 1.4% | 4.8% | 2.0% | 3.0% | 5.7% | 6.9% | 6.2% | 6.9% |
Retail – Misc. Store Retailers** | 4.1% | 9.9% | 9.5% | 6.9% | 8.9% | 7.5% | 9.2% | 10.8% | 5.4% | 7.4% |
Retail – Non-Store Retailers | 6.2% | 3.1% | 7.1% | 3.6% | 3.2% | 3.2% | 13.0% | -9.8% | 0.3% | 0.7% |
Source: PNC Internal data
Note: Table reports year-over-year percent change in total card spending by category (aggregate) not per-household spending. ‘Funds transfer’ and ‘Other’ categories omitted.
* ‘Gas & Service Stations reflects total card spend at gas station merchants, capturing fuel purchases alongside convenience retail and ancillary auto-related spending.
** ‘Retail – Misc. Store Retailers’ includes spending on ‘Sports/Books/Hobby/Music.’
- The data is based on aggregated and anonymized selections of PNC data. The data may have a degree of selection bias due to selected populations and data availability.
- Card spend trends are based on aggregated debit card and credit card transaction data for a fixed cohort of Retail customers. Spending is categorized using standard Merchant Category Codes (MCC) defined by financial services companies. Spending data may also be grouped using other proprietary methods.
- Gasoline spend is limited to purchases made via automated fuel dispensers, “at the pump” card transactions.
- Balance data is aggregated for a fixed cohort of households that had a consumer deposit account (checking, savings, and/or certificate of deposit) for all months from January 2019 through the current month shown.
- Consumer payroll, unemployment, tax refund, and brokerage flows are based on ACH and other electronic payment methods classified using proprietary methods.
- Lower-, middle-, and higher-income views are based on estimated household income, calculated using the most recent 12 months of credit transactions into consumer deposit accounts. Households are divided into terciles: the bottom third is classified as lower income, the middle third as middle income, and the top third as higher income. Income terciles are updated periodically.
- Savings buffer days measure the number of days a household could maintain its current spending using existing checking and savings balances if no new income were received.
- Our paycheck-to-paycheck metric measures the ratio of non-savings-related outflows from consumer deposit accounts to total inflows into those same accounts. Households with monthly outflows equal to or greater than 90% of inflows are categorized as living paycheck-to-paycheck.
- Credit card balance and payment rate data are based on a fixed cohort of credit card accounts from 2019 to present and do not represent PNC’s overall credit card portfolio.
- Refer to the notes beneath the charts and tables for further details about the data presentation. Occasionally, a 3-month moving average is employed to ensure smoother results.
- Generations: we use Pew Research Center's definitions. Millennials are those born 1981–1996 and Gen Z are those born 1997–2012. Generational boundaries are not scientifically defined, and other sources may shift them by a year or two.
- Same-age comparisons: because Gen Z is still young, we compare the two generations at the same ages, not as whole generations. Each comparison uses the Millennial and Gen Z birth years that fall in a given age band at two points roughly a decade apart. Most comparisons use survey years 2015 and 2025, or the nearest available years. The exact age band, birth years and survey years for each measure are noted beneath each chart.

Consumer Health Check archives are available.
The material presented and the views expressed herein are of a general nature and does not constitute the provision of investment or economic advice to any person, or a recommendation of any particular securities, financial instruments, strategies or banking services. Opinions and forecasts expressed herein are subject to change without notice. Relevant information was obtained from sources deemed reliable. Such information is not guaranteed as to its accuracy. You should seek the advice of an investment professional to tailor a financial plan to your needs. To the extent that these materials reference PNC data, such materials are not intended to be reflective or indicative of, and should not be relied upon as, the results of operations, financial condition or performance of PNC.
Forward-looking statements are necessarily subject to numerous assumptions, risks and uncertainties, which change over time. Future events or circumstances may change our outlook and may also affect the nature of the assumptions, risks and uncertainties to which our forward-looking statements are subject. Forward-looking statements speak only as of the date made. We do not assume any duty and do not undertake any obligation to update forward-looking statements. Actual results or future events could differ, possibly materially, from those anticipated in forward-looking statements, as well as from historical performance. As a result, we caution against placing undue reliance on any forward-looking statements.
“PNC” is a registered mark of The PNC Financial Services Group, Inc.
© 2026 The PNC Financial Services Group, Inc. All rights reserved.