


CONSUMER HEALTH CHECK | NOVEMBER 2026
Are higher prices finally catching up to consumers?
Consumer resilience persists, but pressures are building

By Brian LeBlanc
Head of Economic Analysis, PNC Economics Research
Economist's Note
Spending remains solid but momentum is slowing, with households relying more on credit cards.


Are higher prices finally catching up with consumers?
Consumer spending has remained remarkably resilient in 2026. Despite rapid increases in gasoline prices, ongoing affordability concerns, above-trend inflation, and higher interest rates, spending actually accelerated through the first half of the year. As we've written about previously, this resilience likely reflects two main factors. First, household balance sheets were very healthy entering the year, providing room to absorb these shocks. Second, larger tax refunds in the spring helped shelter consumers from the impact of higher prices.
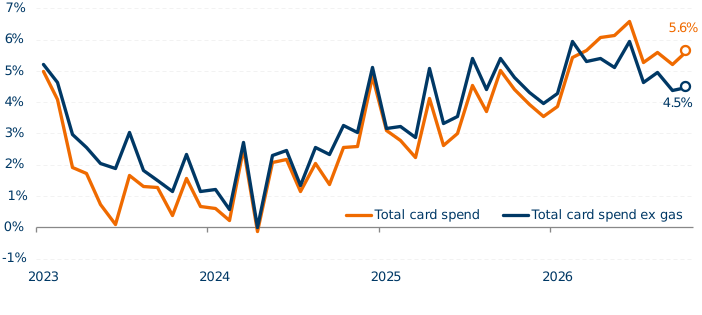
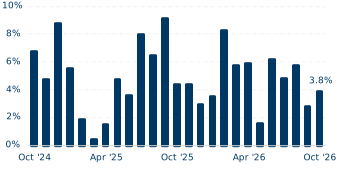
Spending remained solid on a seasonally adjusted year-over-year (YoY) basis in October, with total card spending increasing 5.6% YoY and 4.5% excluding gasoline. However, momentum has been weaker in recent months. Card spending outside of gasoline has increased at only a 3.8% annualized pace over the past three months, barely enough to keep pace with inflation.
Figure 1: YoY percentage change in combined debit and credit card spending, seasonally adjusted
Source: PNC internal data
Note: Seasonally adjusted by PNC. Growth is the year-over-year percentage change in monthly seasonally adjusted spending.
Figure 2: Card spending excluding gas: 3-month annualized growth
Source: PNC internal data
Note: Combined debit and credit card spending, seasonally adjusted
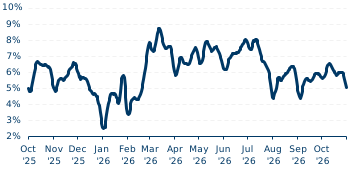
Figure 3: YoY growth rate of daily card spending on discretionary items
Source: PNC internal data
Note: 28D moving average
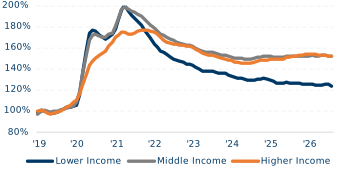
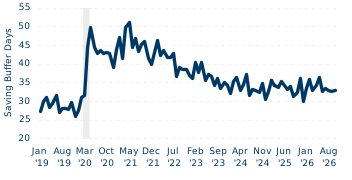
So, is the impact of higher prices finally catching up with consumers? We think the evidence is mixed. For one, household balance sheets remain very healthy by historical standards. Average checking and savings balances remain elevated even after accounting for inflation, median savings buffers remain stable, and the percentage of households living "paycheck-to-paycheck" has not increased in 2026.
Figure 4: Median inflation-adjusted checking and savings deposit balances as a % of ‘19 levels (3M MA)
Source: PNC internal data
Note: Chart shows data seasonally adjusted by PNC and deflated using PCE price index, 3-month moving average (3M MA)
Figure 5: Median days of household savings buffers
Source: PNC internal data
Note: Chart shows the number of days households can maintain current spending using existing cash balances if no new income comes in.
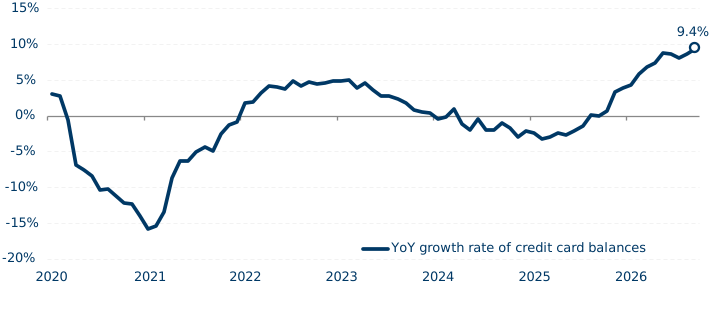
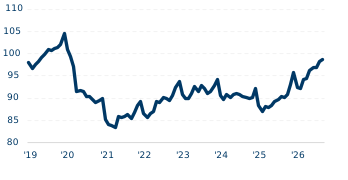
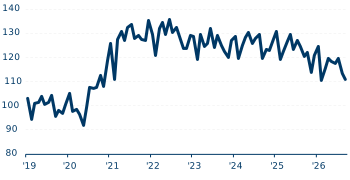
On the other hand, there is evidence that households are relying more heavily on credit cards to sustain spending. To be clear, credit card balances per active account remain low, but they have increased by more than 9% over the past year, the fastest pace since before the pandemic. Additionally, the fraction of balances being paid off each month has steadily declined through 2026.
Figure 6: Credit card balances are increasing at the fastest pace since before the pandemic
Source: PNC internal data
Note: Chart shows the YoY growth rate of credit card balances per active account. Latest available data September 2026.
Figure 7: Credit card balance per active account, 2019 = 100
Source: PNC internal data
Note: Chart shows the average credit card balance per active account. Latest available data is September 2026
Figure 8: Index of credit card balances paid off each month, 2019 = 100
Source: PNC internal data
Note: Chart shows the proportion of outstanding credit card balances that are being paid off each month per active account. Latest available data September 2026.
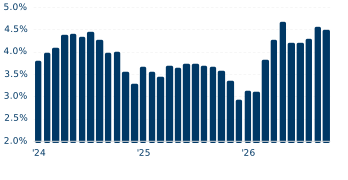
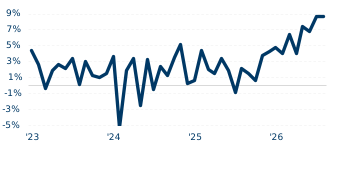
We're also seeing some evidence of inflation fatigue in the composition of consumer spending. Gasoline has accounted for an increasing share of spending as prices have risen, while spending growth at discount retailers and wholesale clubs has accelerated markedly.
Figure 9: Percent of total card spend on gasoline
Source: PNC internal data
Note: Monthly nominal spending; not seasonally adjusted.
Figure 10: Card spend at discount stores
Source: PNC internal data
Note: Monthly year-over-year growth, nominal, not seasonally adjusted.
The consumer divide is increasingly generational
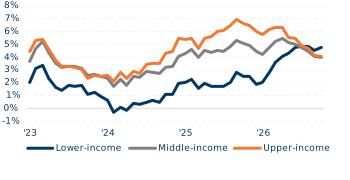
For much of the past few years, the focus has been on the large K-shaped divergence between lower- and upper-income households. The effects of high inflation and a weakening labor market disproportionately fell on lower-income households, whose spending growth stagnated for much of the 2023 to 2025 period. However, that K-shaped pattern has reversed in 2026, with lower-income household spending growth improving considerably and closing the gap with upper-income households.
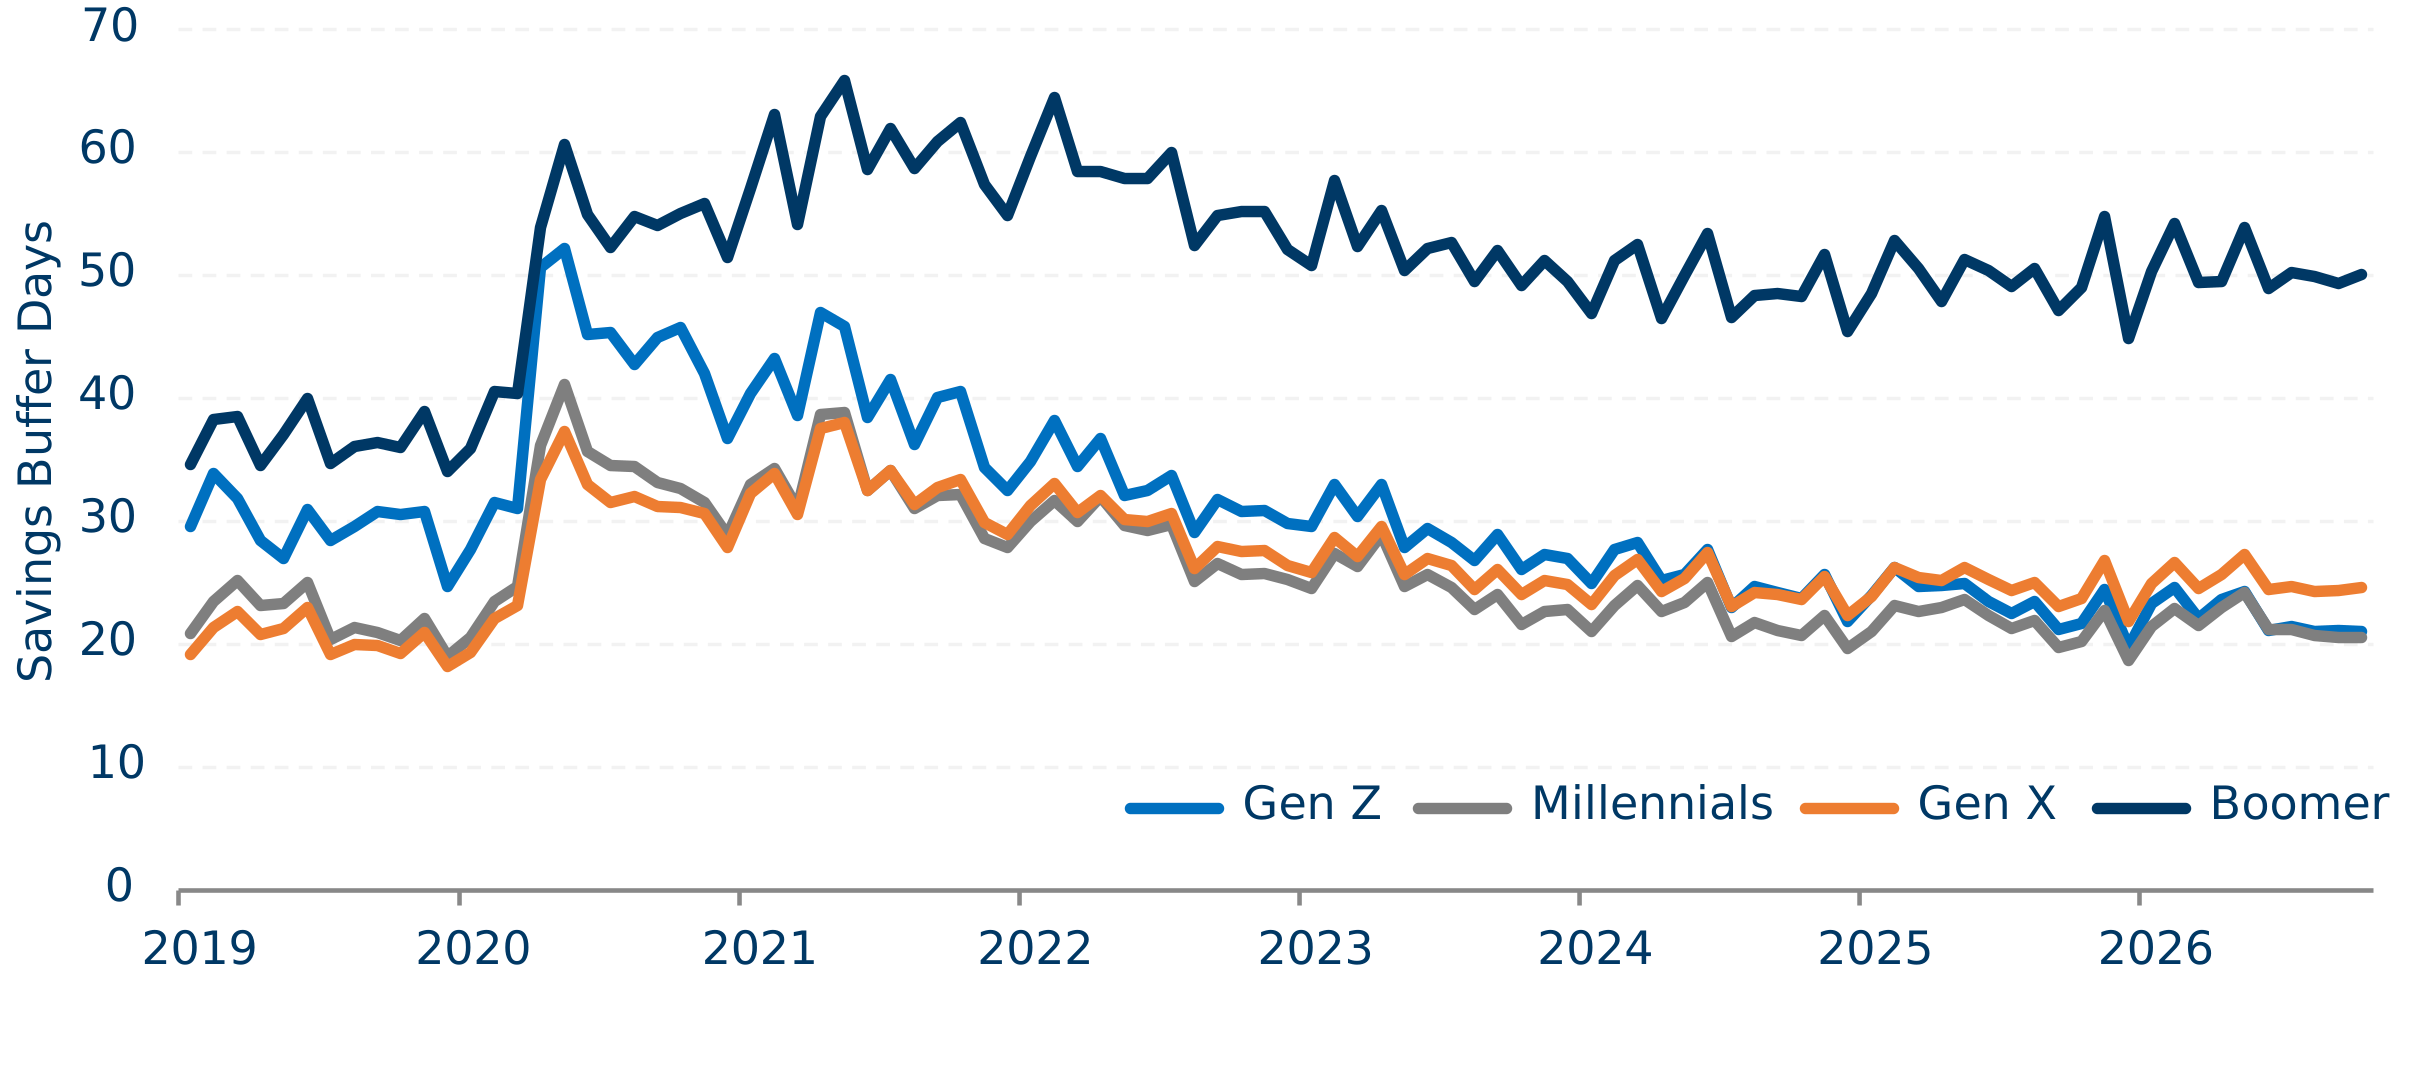
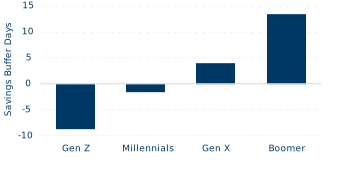
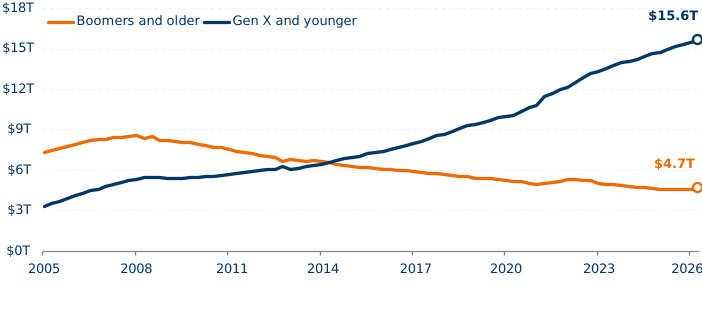
But the narrowing of the income gap does not mean that the financial divide among consumers has disappeared. Instead, it appears to be increasingly generational. Older households, particularly Boomers, have benefited considerably from the large increase in household net worth since the pandemic. Their cash savings remain well above pre-pandemic levels, while savings buffers for younger households have declined much further in recent years.
Figure 11: Household savings buffers by generation (higher = larger savings buffers)
Source: PNC internal data
Note: Chart shows the number of days households can maintain current spending using existing cash balances if no new income comes in.
Figure 12: Household savings buffers by generation, change versus 2019 averages
Source: PNC internal data
Note: Chart shows the number of days households can maintain current spending using existing cash balances if no new income comes in relative to 2019 averages.
Figure 13: YoY percent change in card spend ex. gas by income
Source: PNC internal data
Note: Growth is computed as the year-over-year percentage change in the three-month moving average of the seasonally adjusted level.
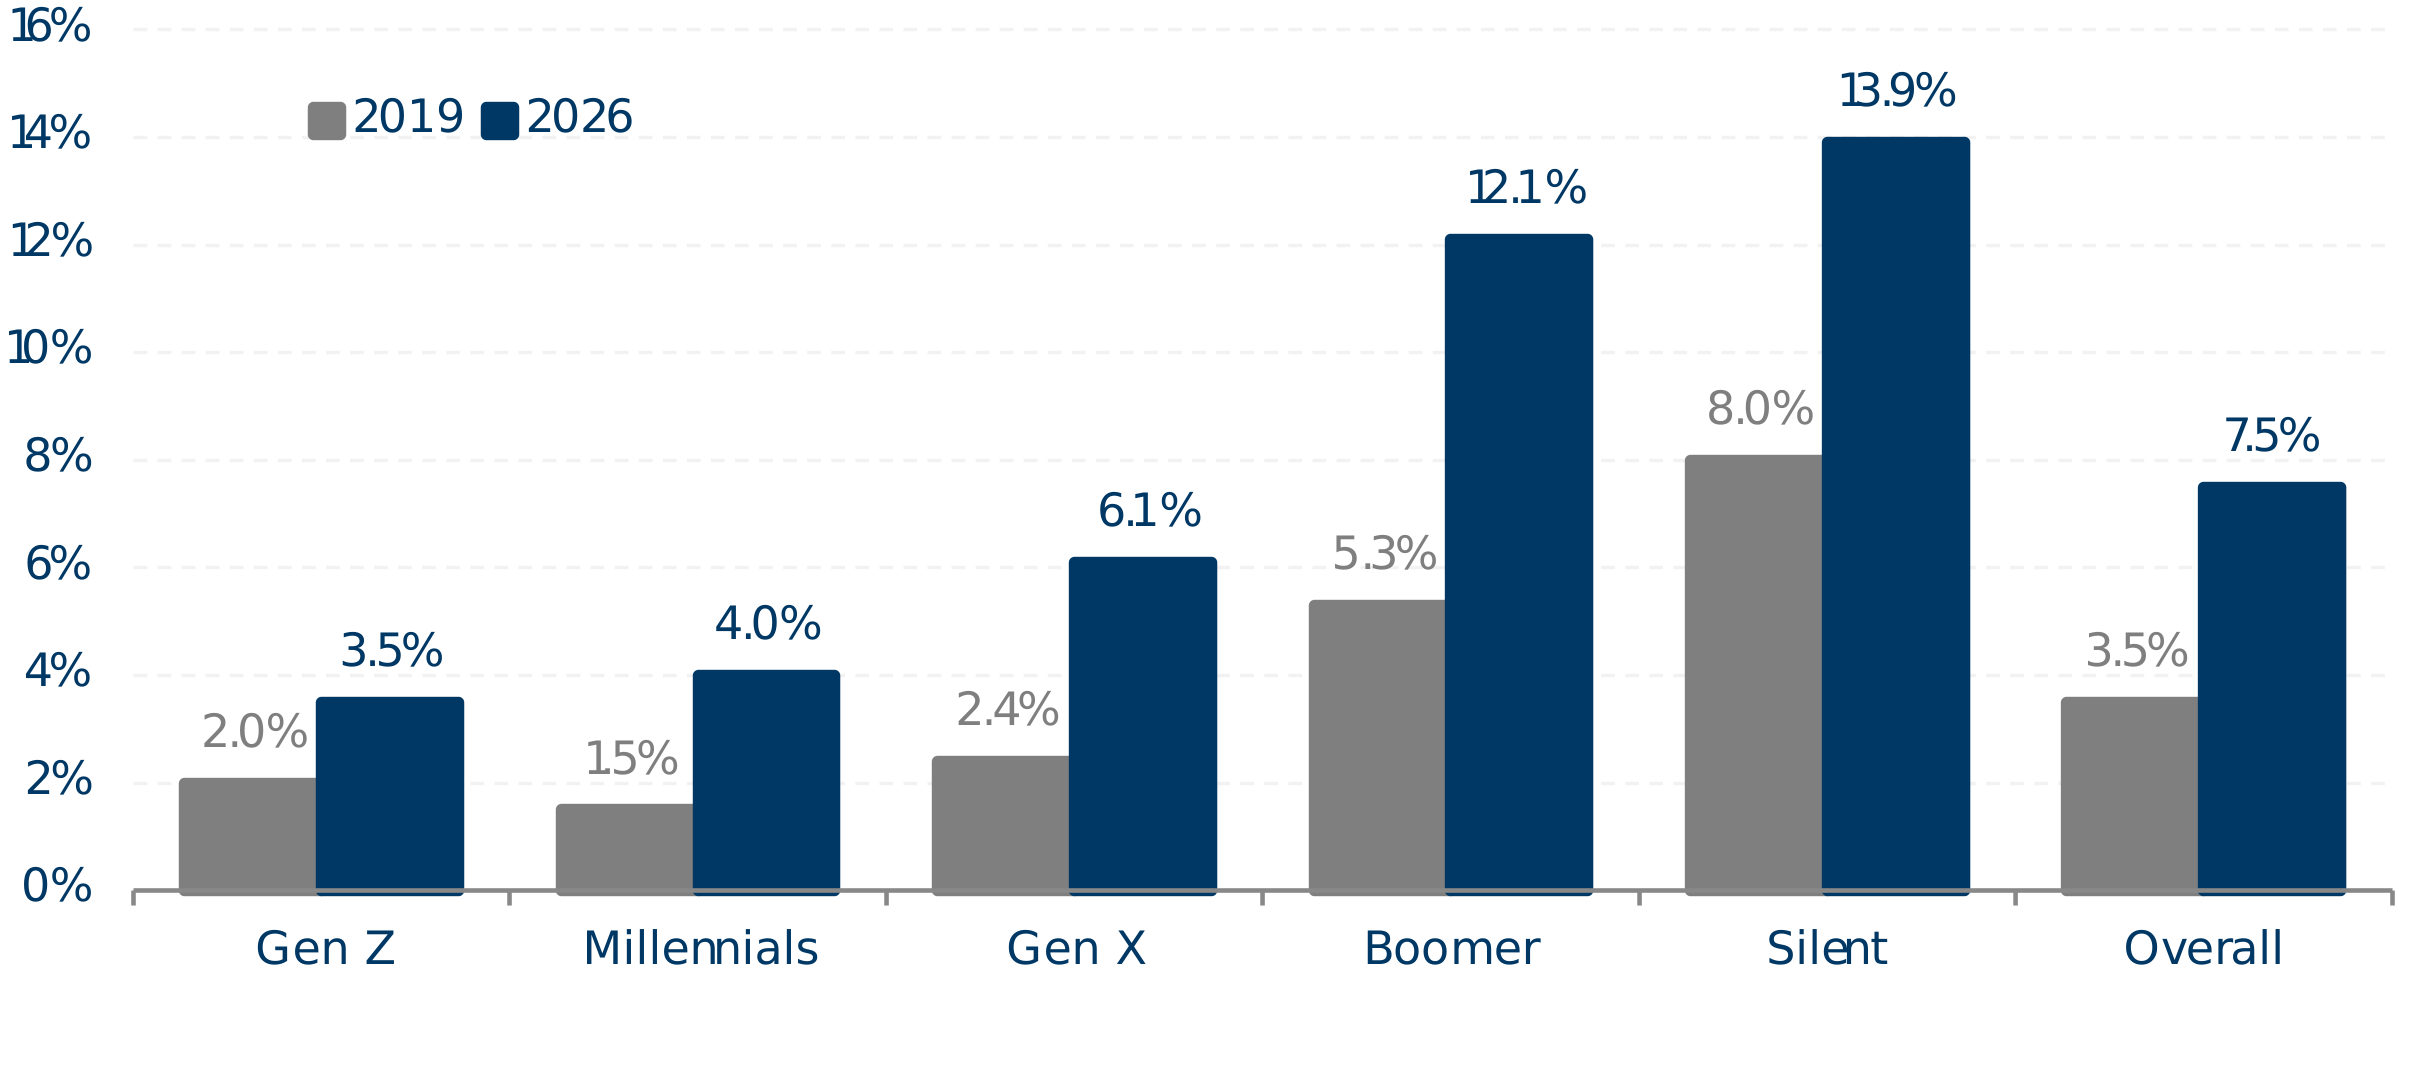
The divide extends beyond cash savings. Boomer households also carry considerably less debt and are seeing substantial net inflows from investment accounts into their checking accounts, providing another source of liquidity following the large increase in equity markets in recent years. Net inflows from investment and brokerage accounts are now equivalent to roughly 12% of Boomer card spending, more than twice the share in 2019.
Figure 14: Inflows from investment accounts as a share of total spend by generation, 2019 vs. 2026
Source: PNC internal data
Note: Shows the ratio of net inflows from investment accounts to total spending over the period from January to October.
Figure 15: Total household debt outstanding, Boomers and older vs. Gen X and younger
Source: Federal Reserve Distributional Financial Accounts (latest data 2026:Q2)
Note: Total household liabilities in trillions of nominal dollars. Boomers and older = born before 1965; Gen X and younger = born 1965 or later (includes Millennials and Gen Z).
More than 90% of gambling spend comes from just 10% of users
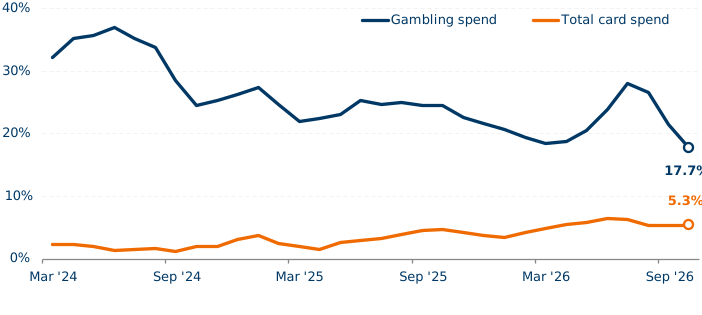
Gambling remains one of the fastest-growing areas of discretionary spending, increasing about 18% over the past year through October. However, the increase in gambling spending is coming from greater intensity rather than broader participation.
Figure 16: YoY percentage change in gambling spending vs. total card spending (3-month moving average)
Source: PNC internal data
Note: Not seasonally adjusted. YoY % change in 3-month moving average of monthly spending. Gambling = sports betting, prediction markets, and other gambling.
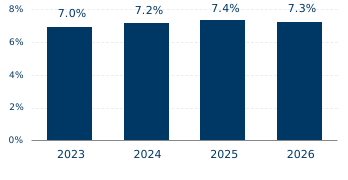
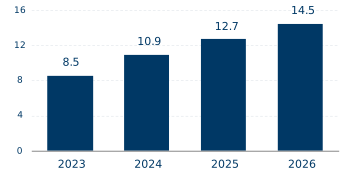
In PNC checking account data, an average of 7.3% of households had gambling or sports-betting activity in a month during January – October 2026, compared with 7.0% in 2023. Instead, households that gamble are doing so much more frequently, with the average number of monthly transactions per active household increasing roughly 70% since 2023, coupled with only about a 5% increase in the average transaction size.
Figure 17: Share of households with gambling spend (gambling plus sports betting)
Source: PNC internal data
Note: Share of households with gambling or sports-betting spending in an average month, Jan–Oct of each year.
Figure 18: Monthly gambling transactions per active household
Source: PNC internal data
Note: Gambling and sports-betting transactions (card and ACH) per household with gambling activity, average month, Jan–Oct of each year.
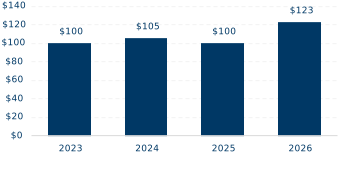
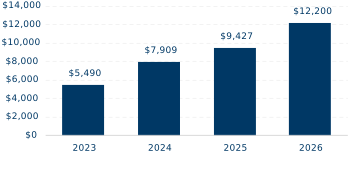
However, the real increase in gambling spending is coming from “super users.” The top 10% of gambling households account for more than 90% of total gambling spending and more than 90% of the increase in spending over the past year. Spending among these heavy users has also intensified considerably: median spending among households in the top 10% has more than doubled since 2023.
Figure 19: Median annual gambling spend for active gambling households
Source: PNC internal data
Note: Chart shows the median spend for the period running January through October for each year shown.
Figure 20: Median annual gambling spend of the top 10% of active gambling households
Source: PNC internal data
Note: Chart shows the median spend for the period running January through October for each year shown
Within gambling households, median non-gambling spending was lower in the highest gambling quartile than the third quartile in all four generations, with the largest difference among Boomers.
The category pattern differs by age. In the highest quartile, travel medians were 7%-19% higher for Gen Z, Millennials and Gen X than in the third quartile; dining medians were also slightly higher. Grocery and general-merchandise medians were lower in all four generations. Among Boomers, dining and travel medians were lower, too. From these comparisons, it does not appear that those spending the most on gambling are cutting back in other areas to fund gambling.
Figure 21: Category spending differences vary by generation
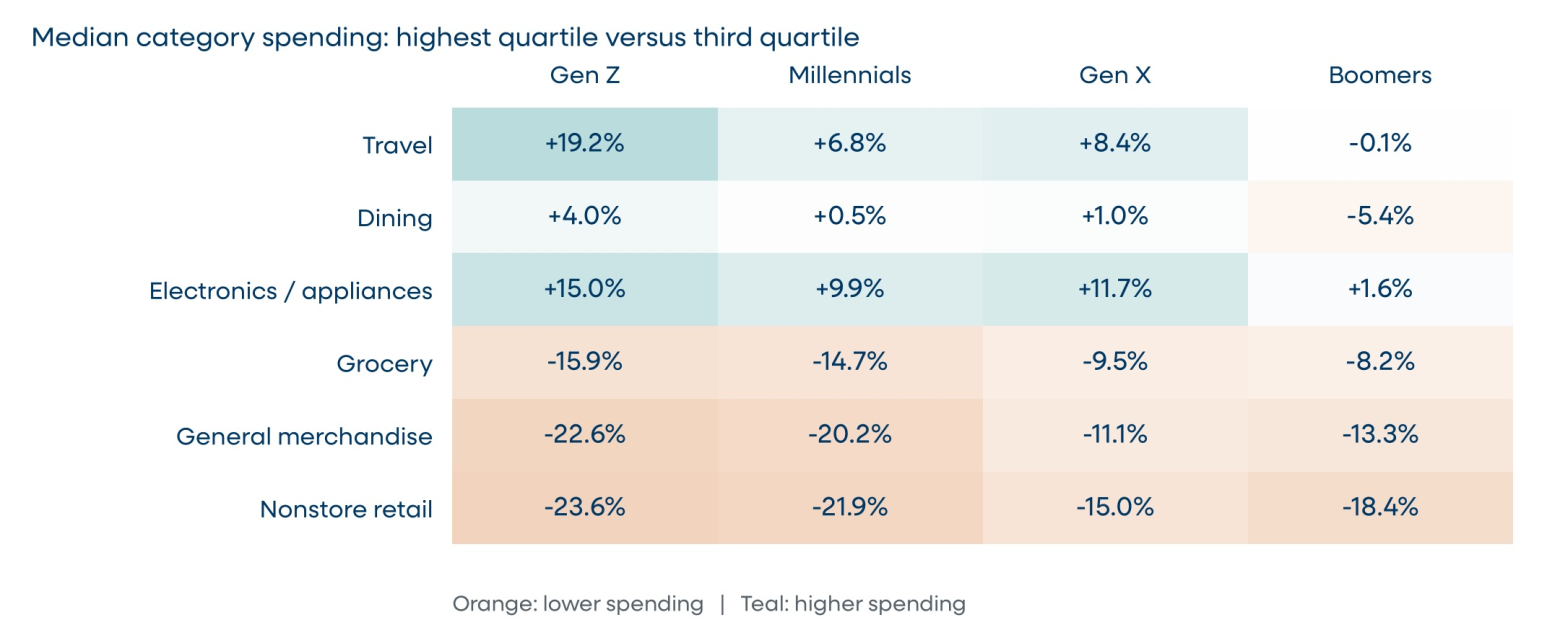
Source: PNC household transaction data, October 2025-October 2026 (13 months). Charts compare approximate medians in Q4 with Q3: 100 x (Q4 / Q3 - 1). Quartiles rank observed gambling-related amounts within each generation.
Key Charts and Figures
Indicator | Jan ‘26 | Feb ‘26 | Mar ‘26 | Apr ‘26 | May ‘26 | Jun ‘26 | Jul ‘26 | Aug ‘26 | Sep ‘26 | Oct ‘26 |
| Key Aggregates | ||||||||||
Total Spending | 4.5% | 5.3% | 5.0% | 6.3% | 6.4% | 6.6% | 6.2% | 3.6% | 6.3% | 6.3% |
Total (Ex. Gas Stations) | 5.2% | 5.9% | 4.6% | 5.6% | 5.2% | 6.1% | 5.7% | 2.9% | 5.3% | 5.2% |
| Sector Level | ||||||||||
Auto | 4.9% | 7.7% | 6.3% | 7.6% | 3.6% | 6.8% | 5.2% | 4.2% | 7.7% | 6.8% |
Restaurants and Bars | 3.5% | 3.9% | 0.4% | 3.1% | 3.6% | 1.4% | 3.7% | 0.1% | 2.7% | 3.5% |
Food/Beverage Stores | 3.0% | 0.4% | -0.8% | -0.1% | 1.1% | -1.4% | 0.5% | -3.6% | -1.1% | -0.8% |
Gambling | 16.7% | 12.9% | 13.4% | 17.8% | 18.1% | 22.6% | 26.7% | 11.3% | 10.3% | 13.2% |
Gas and Service Stations* | -6.0% | -3.2% | 12.0% | 17.1% | 25.2% | 14.4% | 13.8% | 12.8% | 21.4% | 22.8% |
Hotels | 0.2% | 2.1% | -0.1% | 3.4% | 1.3% | -1.0% | 2.7% | 0.5% | 4.1% | 1.0% |
Leisure | 4.1% | 5.1% | 2.7% | 5.6% | 4.4% | 4.9% | 3.6% | 2.6% | 5.6% | 4.0% |
Services | 4.2% | 6.4% | 6.7% | 6.7% | 5.1% | 8.2% | 8.3% | 6.3% | 7.7% | 7.1% |
Travel | 3.2% | 7.4% | 6.7% | 6.8% | 6.4% | 7.4% | 7.7% | 5.9% | 7.3% | 5.8% |
Retail – Building/Garden/Supplies | 0.6% | -3.0% | -0.7% | 6.0% | -0.2% | 2.2% | 1.7% | -1.2% | 3.9% | 3.9% |
Retail – Clothing Accessories | 1.9% | 4.5% | 0.7% | 1.9% | 0.6% | 1.2% | 3.4% | -1.0% | 4.1% | 2.3% |
Retail – Electronics and Appliances | 11.3% | 11.1% | 9.0% | 7.3% | 10.6% | 11.7% | 11.1% | 11.3% | 14.3% | 12.7% |
Retail – Furniture and Home Furnishings | 3.5% | 3.8% | -0.6% | 2.1% | 6.1% | 4.4% | 4.0% | -0.1% | 7.6% | -0.8% |
Retail – General Merchandise Stores | 4.7% | 4.6% | 3.7% | 4.9% | 7.5% | 6.0% | 7.3% | 6.3% | 7.8% | 9.0% |
Retail – Health and Personal Care | -1.2% | 1.4% | 4.8% | 2.1% | 3.0% | 5.8% | 7.0% | 6.3% | 7.0% | 8.2% |
Retail – Misc. Store Retailers** | 9.9% | 9.5% | 6.9% | 8.9% | 7.5% | 9.3% | 10.9% | 5.5% | 7.5% | 9.7% |
Retail – Non-Store Retailers | 3.1% | 7.1% | 3.7% | 3.2% | 3.3% | 13.1% | -9.8% | 0.4% | 0.8% | -0.1% |
Source: PNC Internal data
Note: Table reports year-over-year percent change in total card spending by category (aggregate) not per-household spending. ‘Funds transfer’ and ‘Other’ categories omitted.
* ‘Gas & Service Stations reflects total card spend at gas station merchants, capturing fuel purchases alongside convenience retail and ancillary auto-related spending.
** ‘Retail – Misc. Store Retailers’ includes spending on ‘Sports/Books/Hobby/Music.’
The data is based on aggregated and anonymized selections of PNC data. The data may have a degree of selection bias due to selected populations and data availability.
- Card spend trends are based on aggregated debit card and credit card transaction data for a fixed cohort of Retail customers. Spending is categorized using standard Merchant Category Codes (MCC) defined by financial services companies. Spending data may also be grouped using other proprietary methods.
- Gasoline spend is limited to purchases made via automated fuel dispensers, “at the pump” card transactions.
- Balance data is aggregated for a fixed cohort of households that had a consumer deposit account (checking, savings, and/or certificate of deposit) for all months from January 2019 through the current month shown.
- Consumer payroll, unemployment, tax refund, and brokerage flows are based on ACH and other electronic payment methods classified using proprietary methods.
- Lower-, middle-, and higher-income views are based on estimated household income, calculated using the most recent 12 months of credit transactions into consumer deposit accounts. Households are divided into terciles: the bottom third is classified as lower income, the middle third as middle income, and the top third as higher income. Income terciles are updated periodically.
- Savings buffer days measure the number of days a household could maintain its current spending using existing checking and savings balances if no new income were received.
- Our paycheck-to-paycheck metric measures the ratio of non-savings-related outflows from consumer deposit accounts to total inflows into those same accounts. Households with monthly outflows equal to or greater than 90% of inflows are categorized as living paycheck-to-paycheck.
- Credit card balance and payment rate data are based on a fixed cohort of credit card accounts from 2019 to present and do not represent PNC’s overall credit card portfolio.
- Refer to the notes beneath the charts and tables for further details about the data presentation. Occasionally, a 3-month moving average is employed to ensure smoother results.

Consumer Health Check archives are available.
The material presented and the views expressed herein are of a general nature and does not constitute the provision of investment or economic advice to any person, or a recommendation of any particular securities, financial instruments, strategies or banking services. Opinions and forecasts expressed herein are subject to change without notice. Relevant information was obtained from sources deemed reliable. Such information is not guaranteed as to its accuracy. You should seek the advice of an investment professional to tailor a financial plan to your needs. To the extent that these materials reference PNC data, such materials are not intended to be reflective or indicative of, and should not be relied upon as, the results of operations, financial condition or performance of PNC.
Forward-looking statements are necessarily subject to numerous assumptions, risks and uncertainties, which change over time. Future events or circumstances may change our outlook and may also affect the nature of the assumptions, risks and uncertainties to which our forward-looking statements are subject. Forward-looking statements speak only as of the date made. We do not assume any duty and do not undertake any obligation to update forward-looking statements. Actual results or future events could differ, possibly materially, from those anticipated in forward-looking statements, as well as from historical performance. As a result, we caution against placing undue reliance on any forward-looking statements.
“PNC” is a registered mark of The PNC Financial Services Group, Inc.
© 2026 The PNC Financial Services Group, Inc. All rights reserved.